


Fundamentals meet Technicals: SoFi Technologies Inc.
A Fundamental and Technical Analysis.


So, today we’ll discuss whether SoFi seems like a stock to keep an eye on or not.
Overview
Today, I’ll cover the following of SoFi:
Fundamental Analysis
Technical Analysis
This is also the framework that I’ll be using when doing a Deep Dive into any company that might be ready to BUY.
If you’re interested in seeing more of these Deep Dives where I discuss a companies Fundamentals and Technicals, make sure to SUBSCRIBE so you don’t miss any FREE insights!
1. Fundamental Analysis
In the next section, I’ll discuss the following things:
General Overview (Total Revenues, Net Income, EBIT, Free Cash Flow)
KPI’s
Skin in the game
Gross Profit and Net Income Margin
ROIC
Goodwill
Capex (Maintenance/growth)
Stock-Based Compensation
Buybacks
Forward P/E
Forward P/FCF
Earnings Growth Model
Reverse DCF
General Overview
In this first part, I’ll discuss the overall fundamentals of the business: Total Revenues, Net Income, EBITDA, Free Cash Flow.
Total Revenues
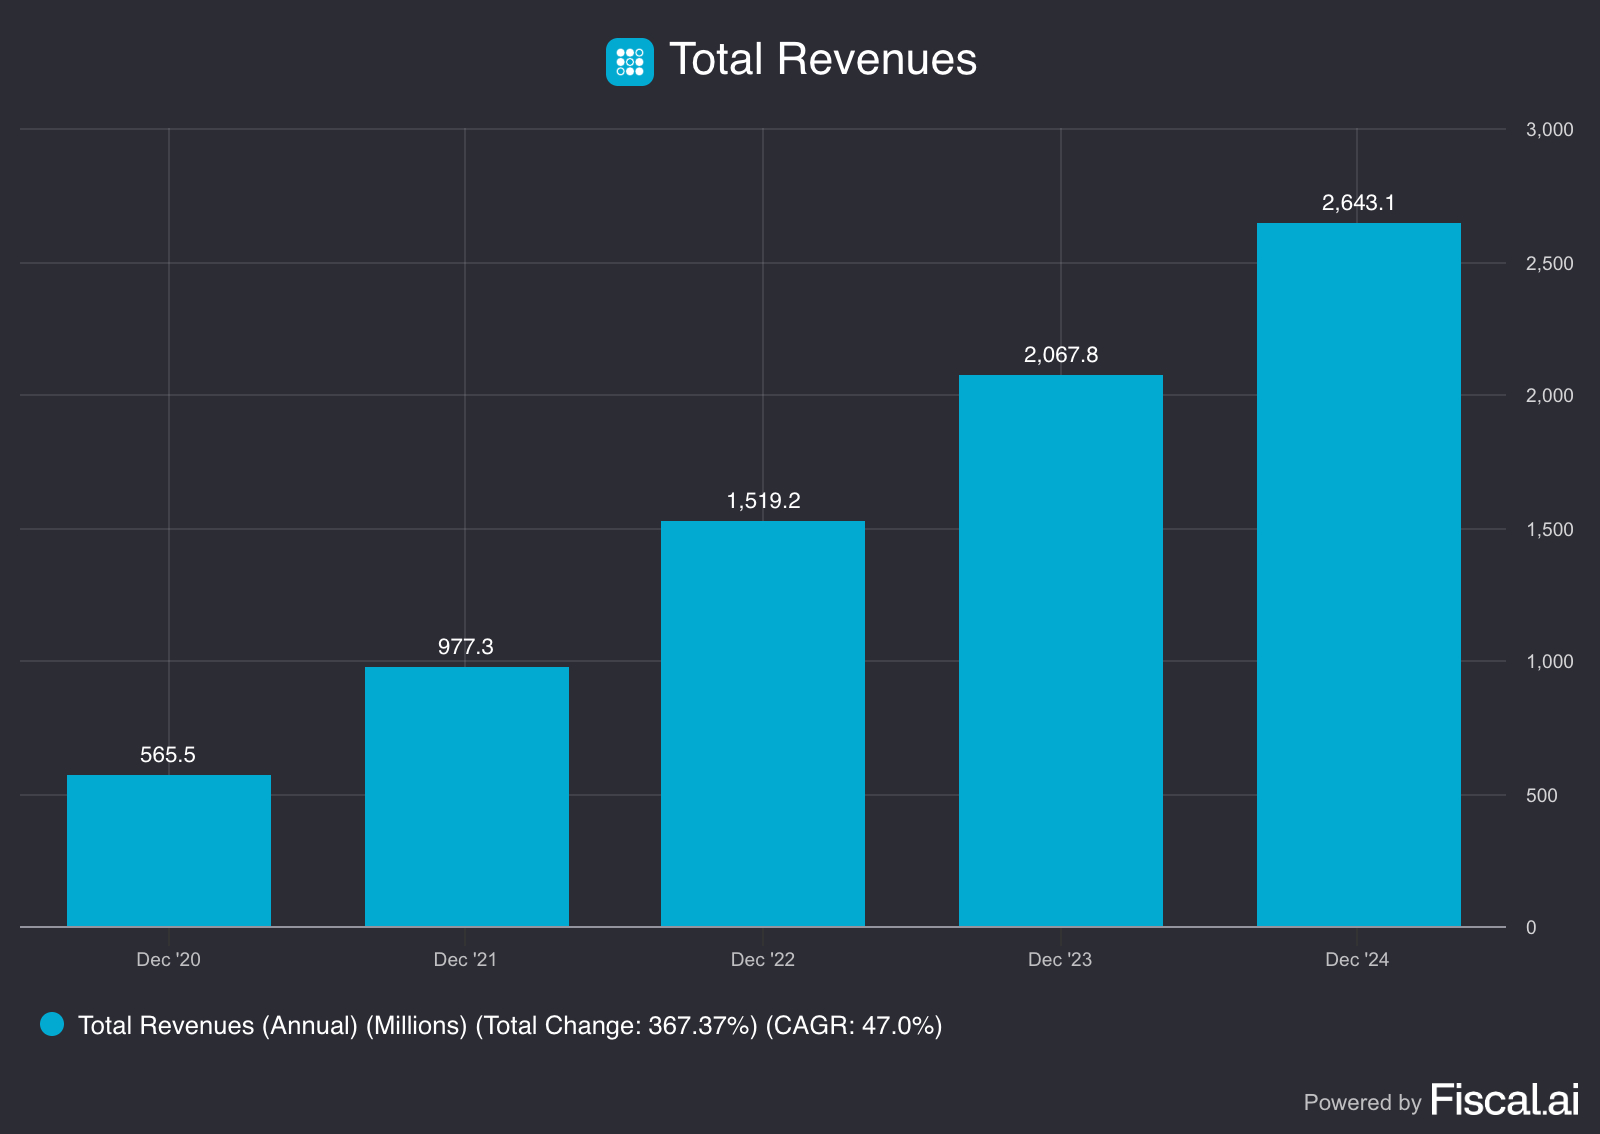
From $565.5 million to $2.64 billion in four years, SoFi has delivered what many fintechs only promise. A 367% total growth with a 47% CAGR makes a standalone company, among the other financial services firms.
What's impressive isn't just the scale, but the consistency. While growth rates are naturally moderating as the base expands (from 73% in 2021 to 28% in 2024), the absolute dollar increases are actually accelerating. This suggests a maturing business model, not a slowing one.
This trajectory represents SoFi's successful evolution from niche student loan refinancer to comprehensive financial platform. Each revenue milestone reflects thousands of customers choosing SoFi over traditional banks and consolidating more of their financial lives within the ecosystem.
The growth story is proven. The key question for investors now is whether SoFi can maintain this momentum while building sustainable profitability in an increasingly competitive fintech landscape.
Net Income
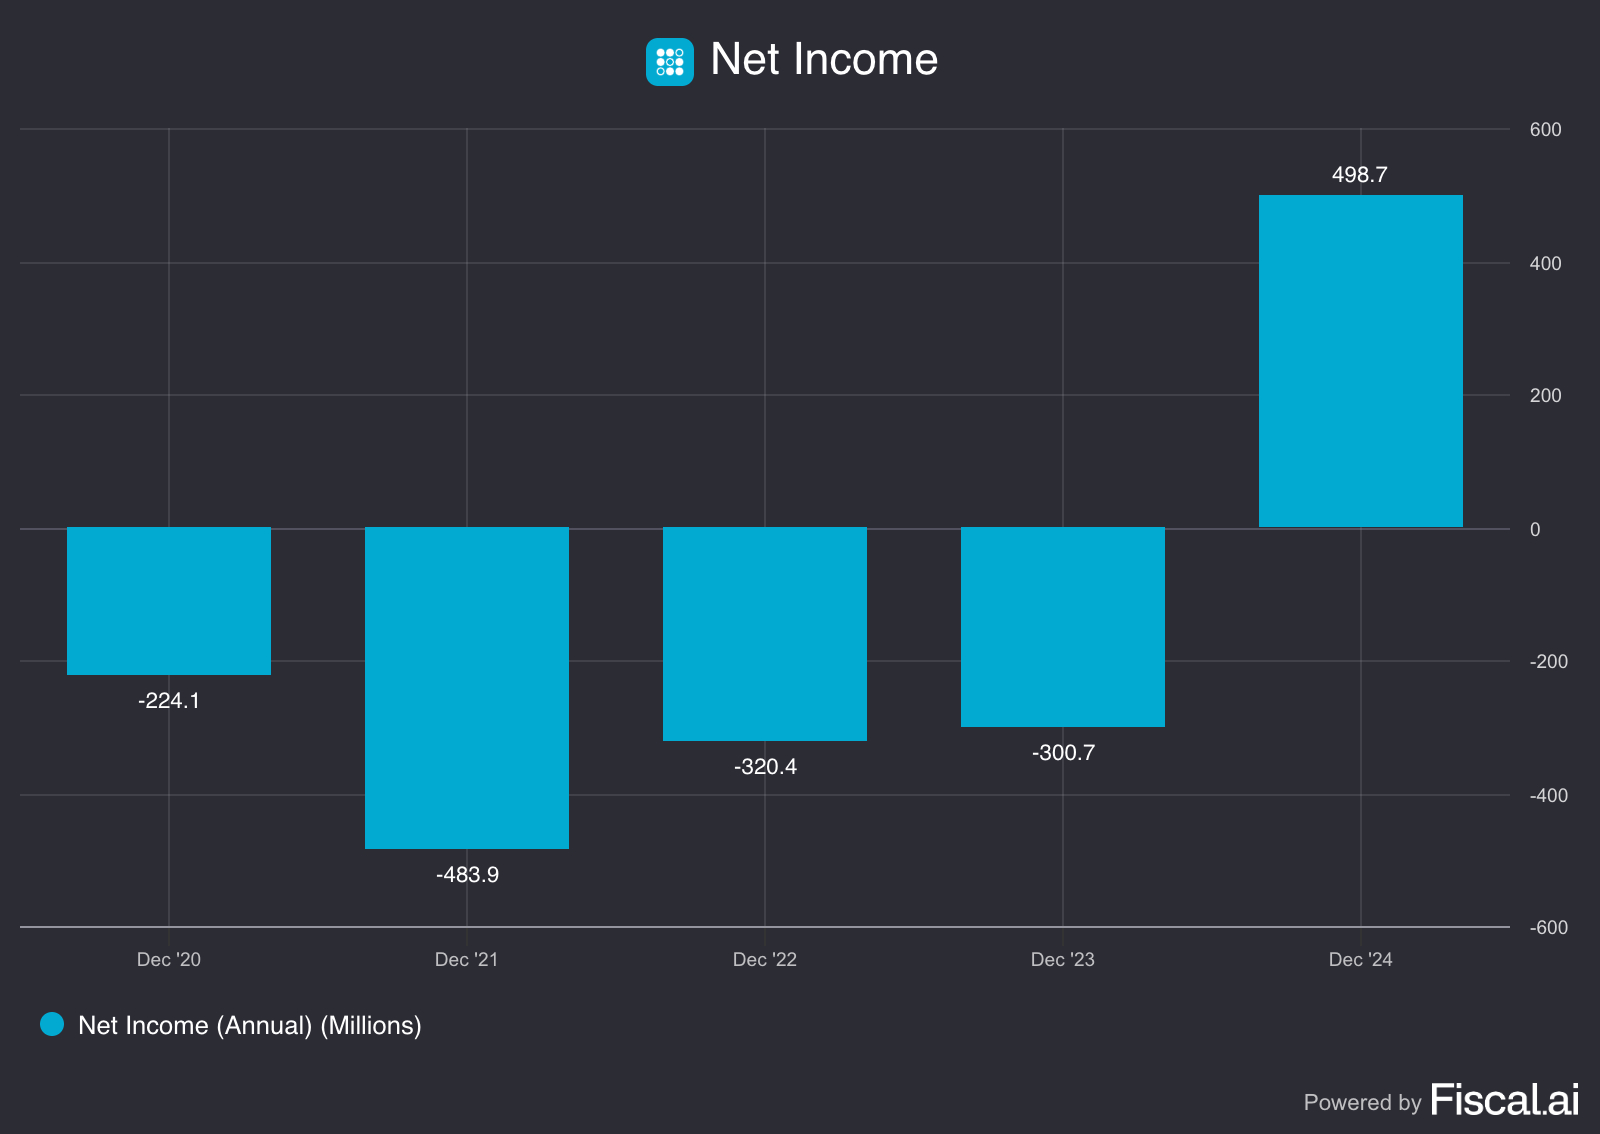
After burning through $1.3 billion over four years, SoFi delivered $498.7 million in net income for 2024, one of fintech's most dramatic turnarounds.
The journey from $224 million losses in 2020 to nearly $500 million profit in 2024 represents more than just operational improvement. It's proof that SoFi's platform economics work at scale. While many fintech competitors still burn cash or barely break even, SoFi achieved what most thought would take years longer.
This inflection is particularly impressive given the challenging environment for growth companies. The question now shifts from "when will they be profitable?" to "can they sustain and grow these margins?"
For investors, this chart represents validation of the growth-to-profitability thesis that many fintech stocks have promised but few have delivered.
EBIT
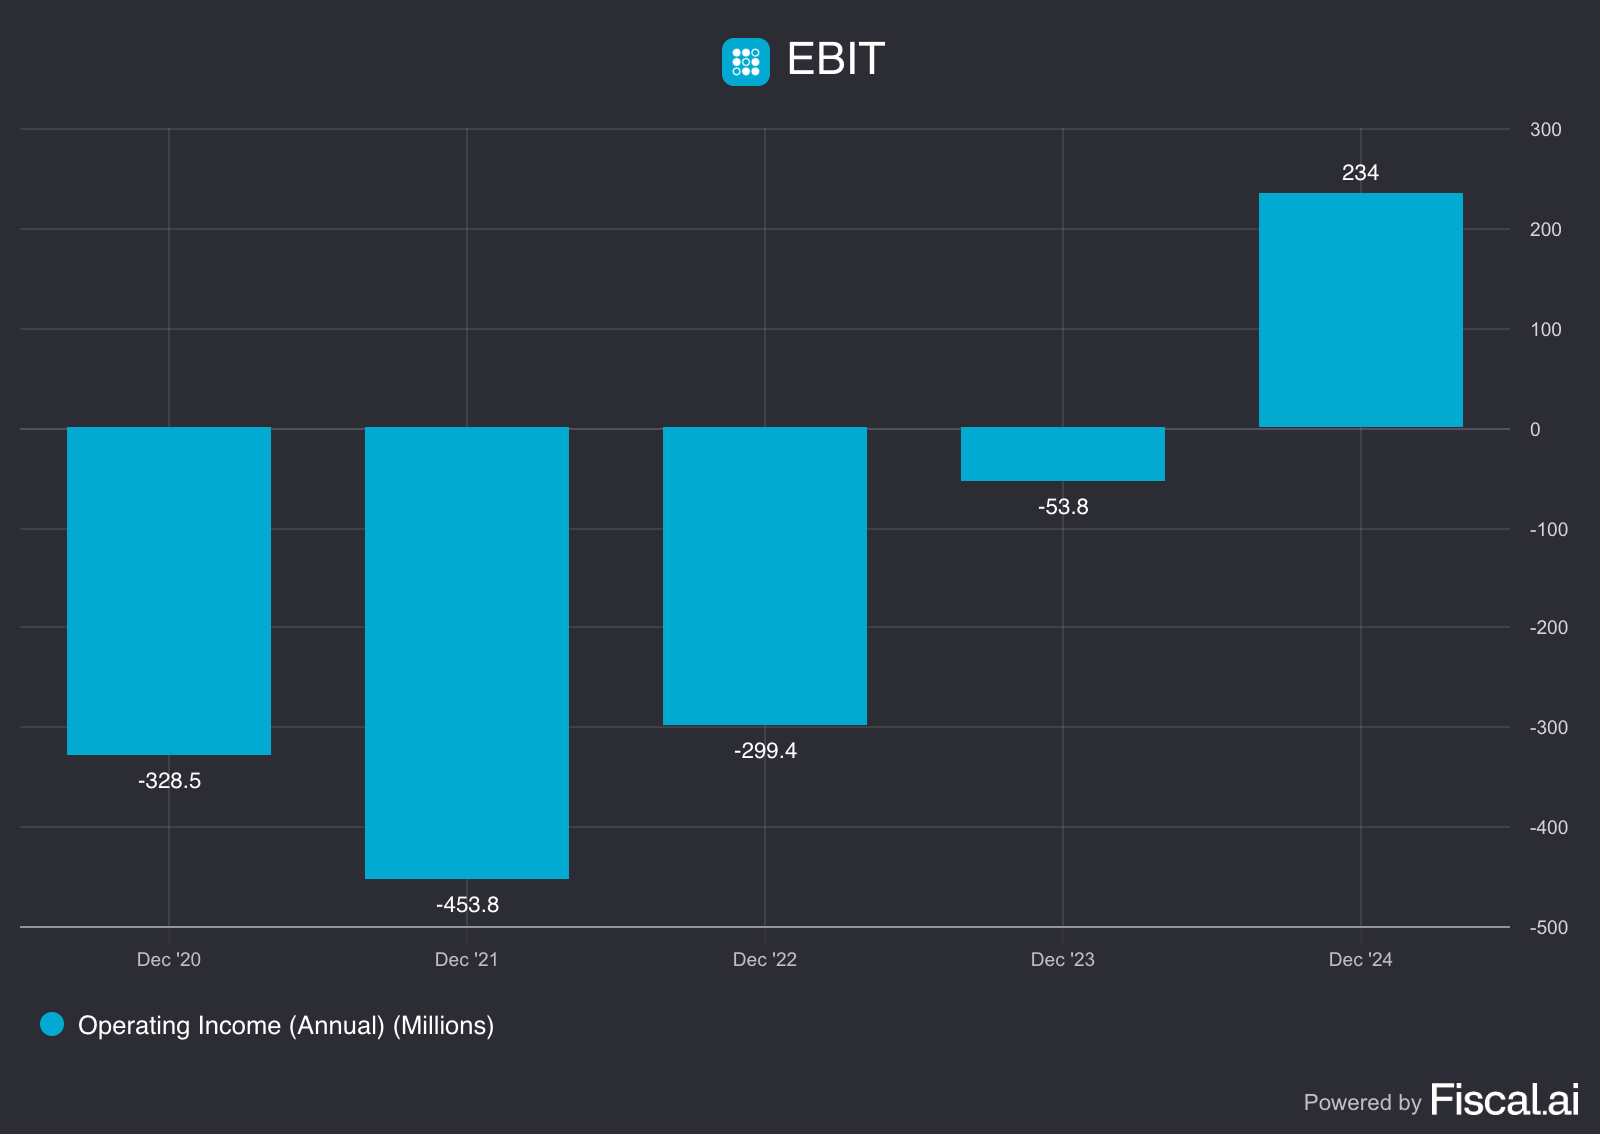
From negative $453.8 million EBIT in 2021 to positive $234 million in 2024, this is what operating leverage looks like in action. SoFi has achieved the holy grail of fintech: turning massive losses into substantial operating profits.
The progression tells a story of disciplined execution. After hitting rock bottom in 2021, losses steadily narrowed through 2022 and 2023 before the dramatic flip to profitability. This wasn't luck, it was the inevitable result of scaling a platform business where fixed costs get spread across exponentially more revenue.
At $234 million EBIT on $2.64 billion revenue, SoFi is now generating healthy 8.9% operating margins. For a company that was burning nearly half a billion in operating losses just three years ago, this represents one of the most impressive operational turnarounds in recent fintech history.
The key insight: SoFi's platform economics work at scale. The question now is whether they can maintain these margins while continuing to invest aggressively in growth.
Free Cash Flow
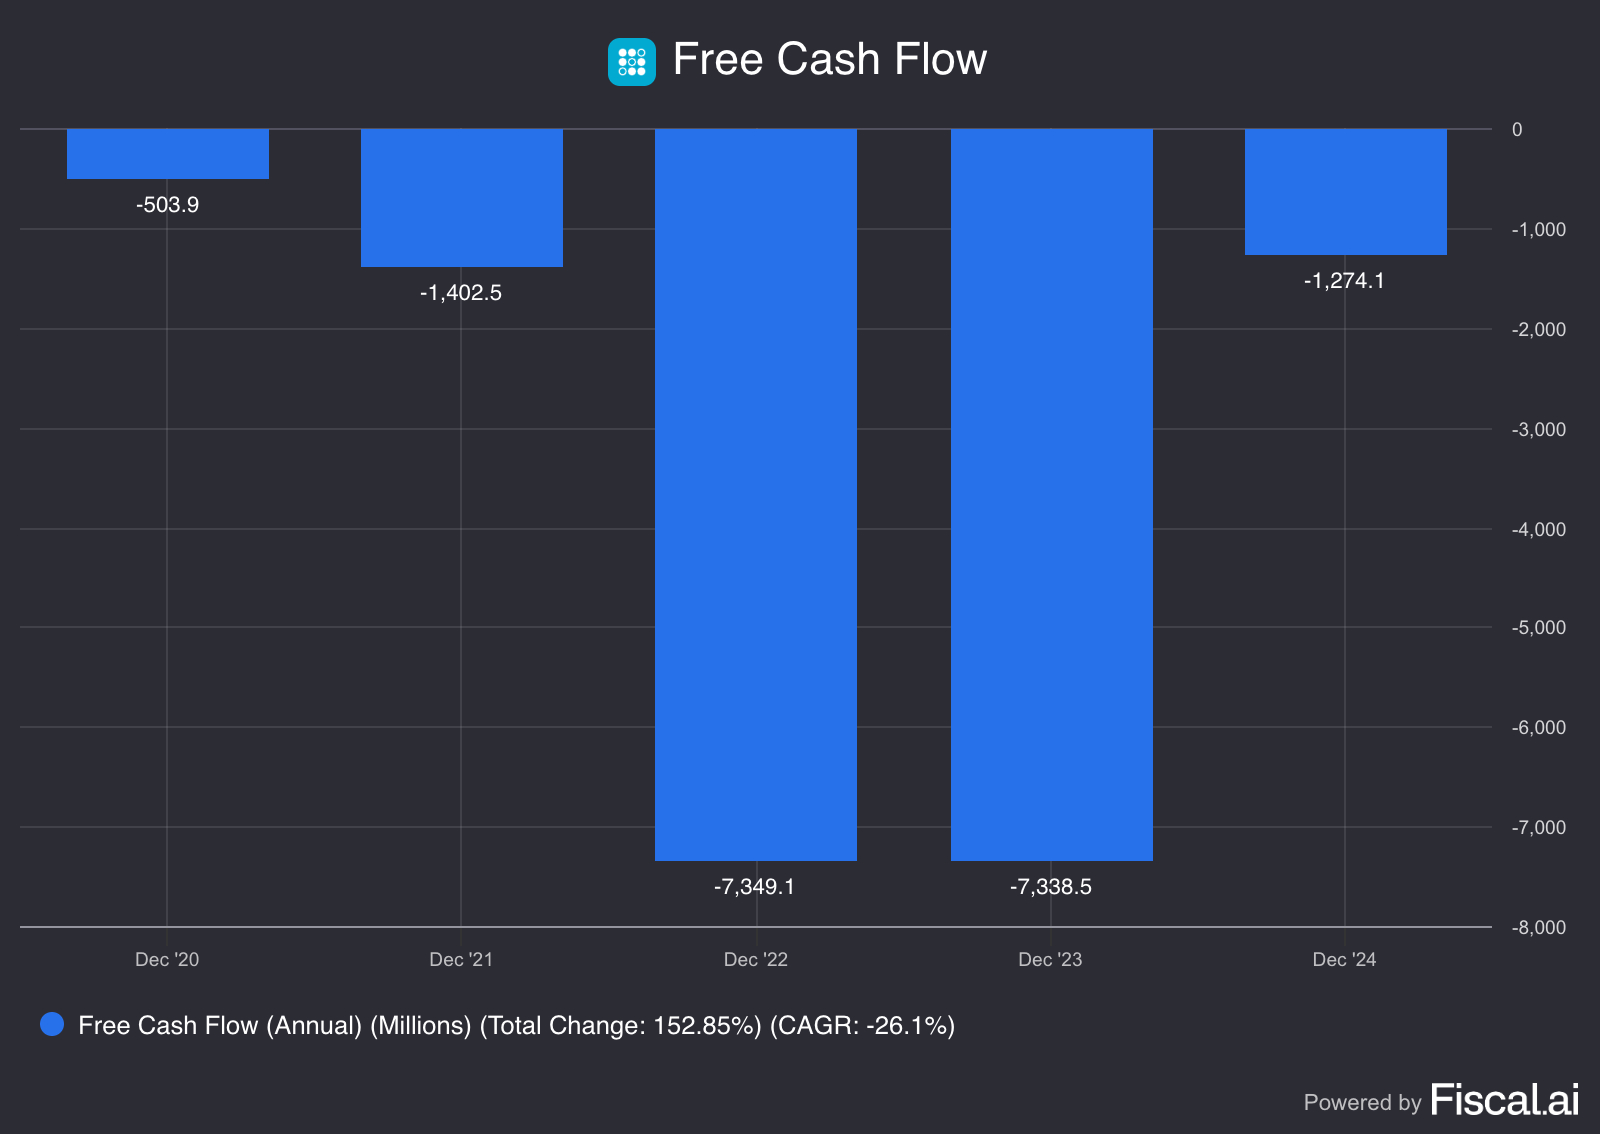
SoFi Technologies has significantly improved its cash flow position over the past five years, with total improvement of 152.85% despite remaining cash flow negative.
Starting at -$503.9 million in December 2020, the company's cash burn initially worsened to -$1.4 billion in 2021, then hit bottom around -$7.3 billion in both 2022 and 2023 during heavy growth investment periods.
The major turnaround came in 2024, with free cash flow improving dramatically to -$1.27 billion, a reduction in cash burn of over $6 billion year-over-year. This represents substantial progress toward operational efficiency.
While still burning cash, the -26.1% CAGR indicates SoFi's losses are shrinking rapidly, suggesting the fintech company is on a clear path toward cash flow breakeven as it matures its business model.
If you enjoy using Fiscal.ai like I do, feel free to check it out through my link:
https://finchat.io/pricing/referralCode=eU7MvaPHfoU2sG5QDaSoUYVvpEb2
(Ps: I don’t get any money out of this, I just get to Unlock Pro for free for 1 month for every user I refer to FiscalAI)
KPI’s
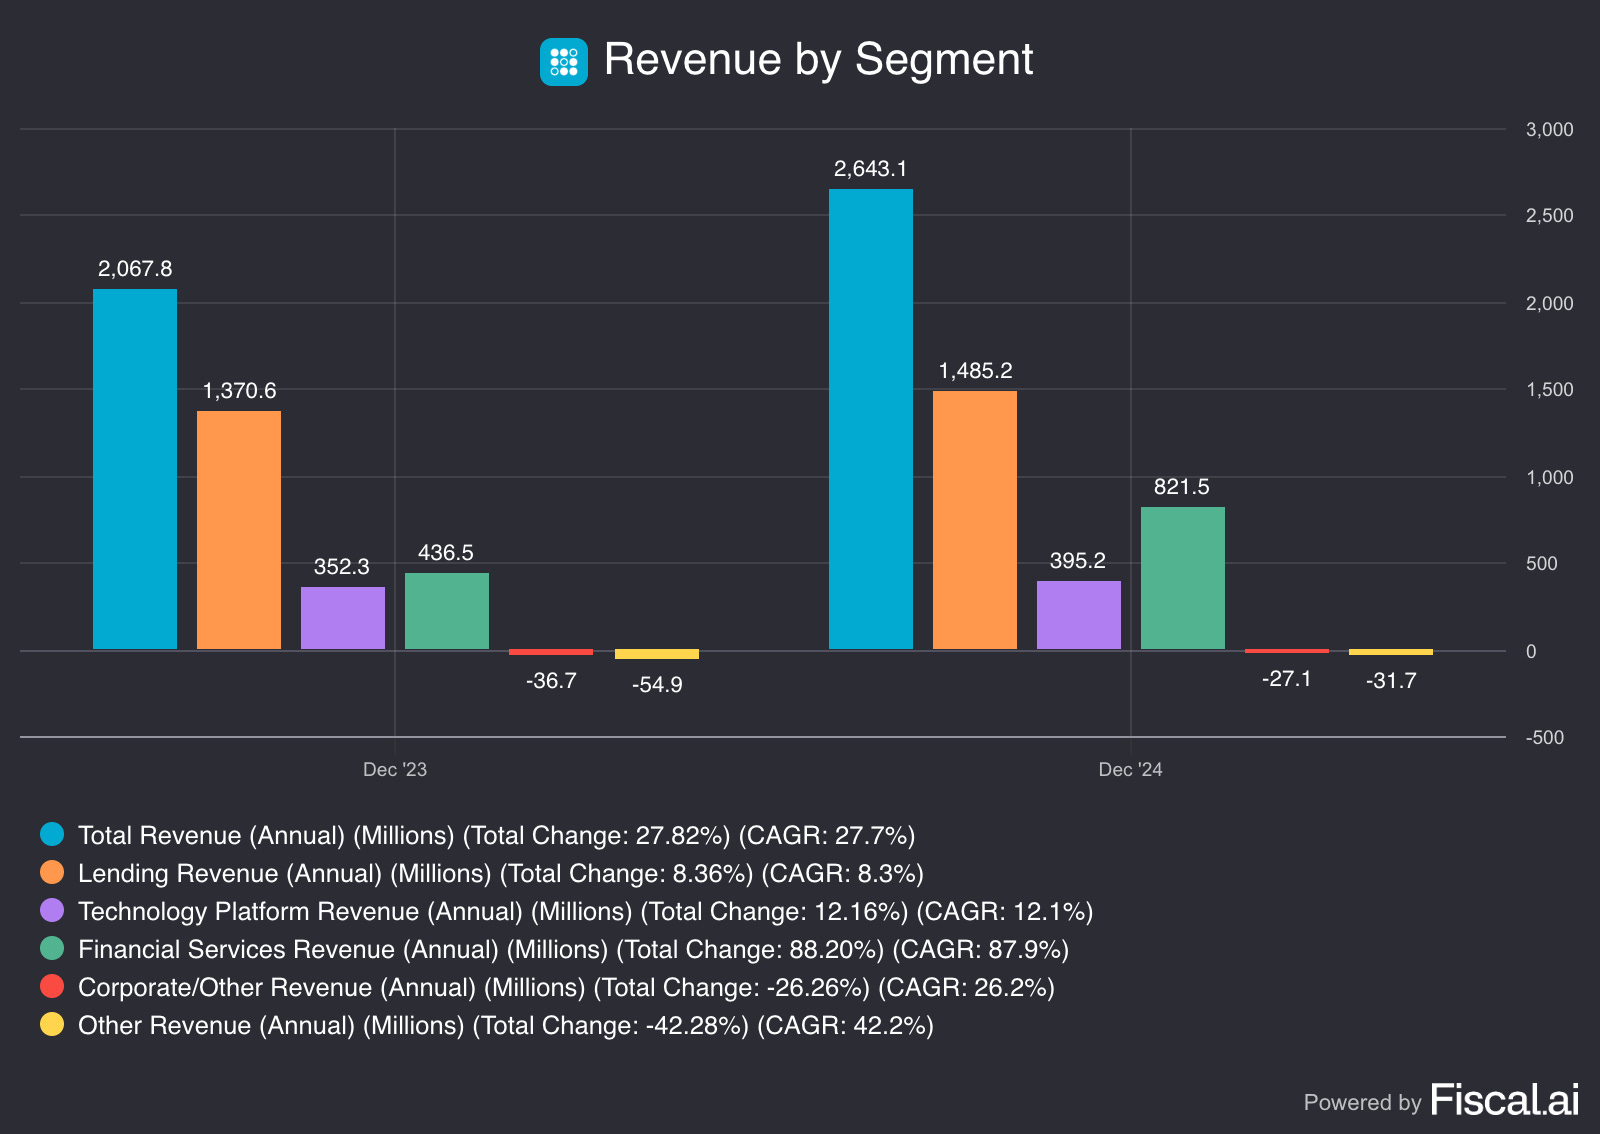
SoFi's total revenue increased 27.82% to $2.64 billion in 2024, driven by strong diversification across segments.
Financial Services was the standout performer, nearly doubling with 88% growth to $821.5 million. Lending Revenue, still the largest segment at $1.49 billion, grew modestly at 8.36%. Technology Platform Revenue showed steady 12% growth to $395.2 million.
Corporate/Other and Other Revenue segments remained negative but improved, with losses shrinking from -$36.7M to -$27.1M and -$54.9M to -$31.7M respectively.
The results highlight SoFi's successful expansion beyond core lending, with Financial Services emerging as a major growth engine and helping drive overall revenue diversification.
Another interesting KPI, is the following one:
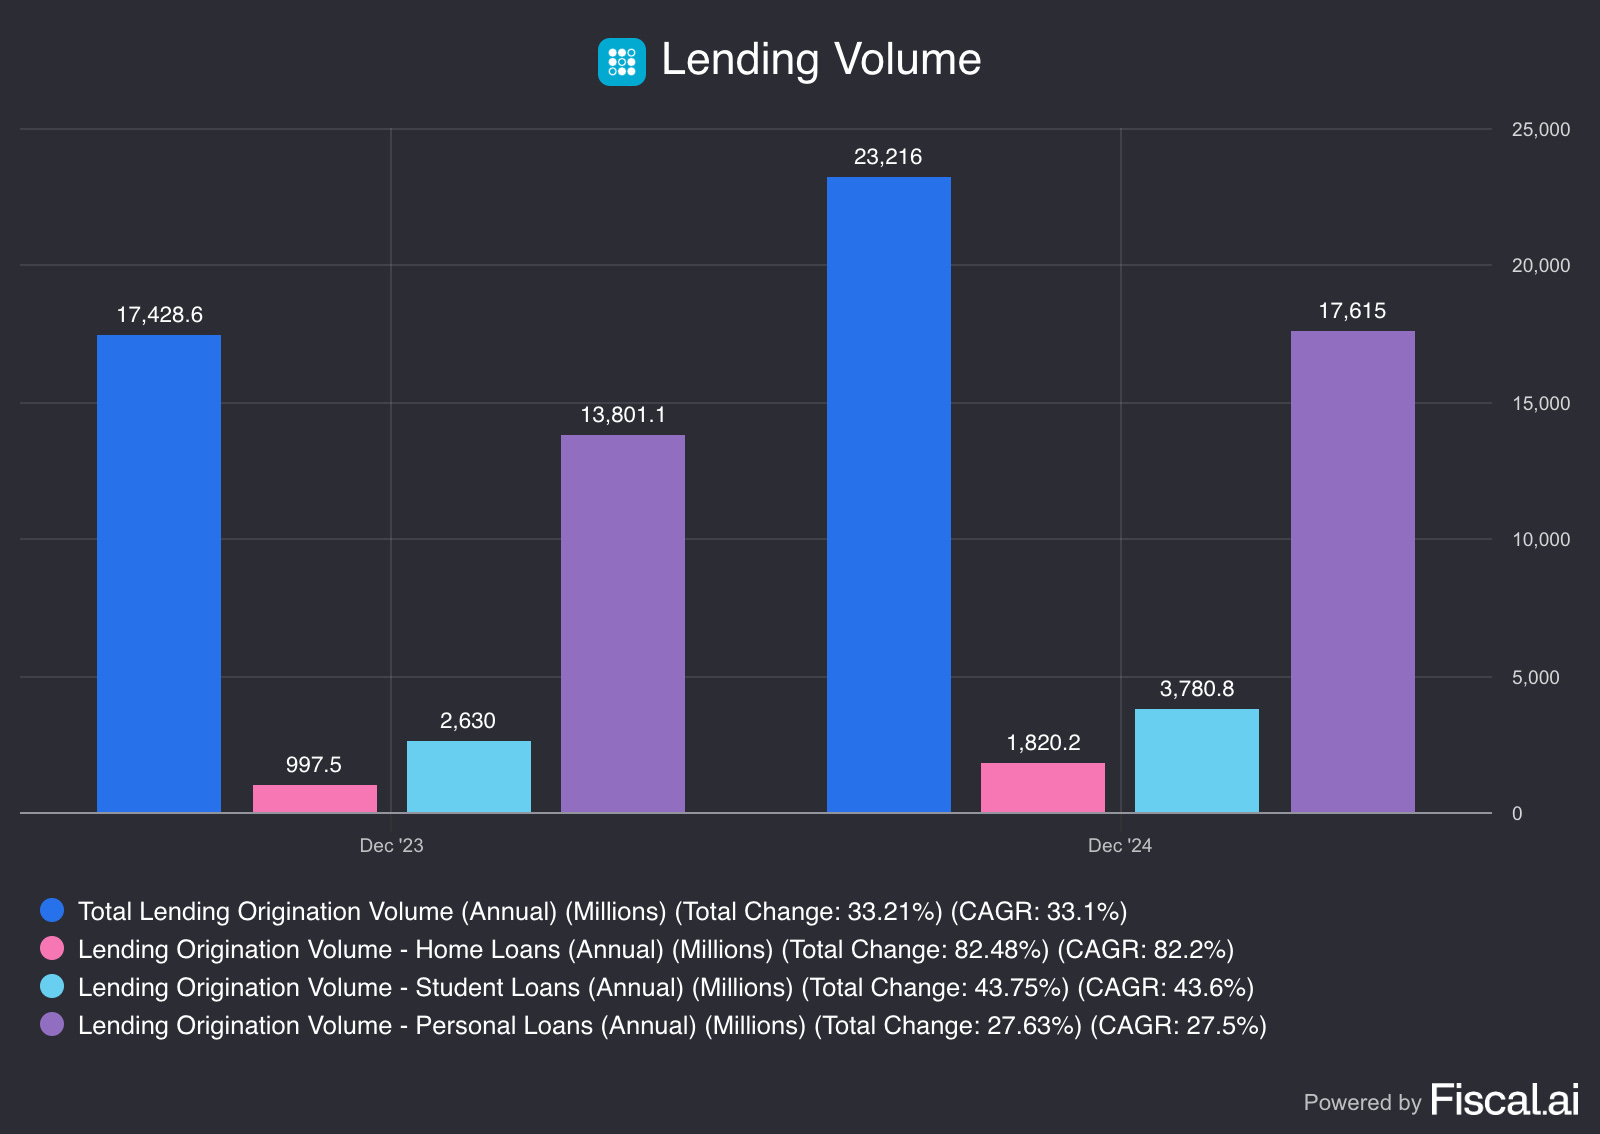
SoFi's total lending origination volume increased strongly to $23.22 billion in 2024, demonstrating robust growth across its lending portfolio.
Home Loans was the standout performer with 82% growth, indicating SoFi's successful expansion into mortgage lending and emergence as a key growth driver.
Student Loans showed solid growth, benefiting from continued demand in the education financing market, while Personal Loans maintained their position as the largest segment with healthy expansion.
The results highlight SoFi's successful diversification beyond its original student loan focus, with home loans emerging as a high-growth area that could become increasingly important to the company's lending strategy.
If you like what you are reading thus far, make sure to SUBSCRIBE so you don’t miss any posts!
Skin in the game
"Skin in the game" matters for investors evaluating management commitment.
SoFi Technologies (SOFI) has insider ownership of just 1.77%, well below the ideal 10% benchmark that typically aligns management incentives with shareholders.
This low ownership could signal limited personal financial commitment from leadership, potentially weakening accountability and long-term thinking.
However, context matters. SoFi went public via SPAC merger in 2021, which often dilutes insider stakes as early stakeholders monetize positions. CEO Anthony Noto has led the company's transformation from student lending into a diversified financial platform since 2018, demonstrating strategic commitment beyond ownership percentages.
The takeaway: While SoFi's low insider ownership isn't ideal, investors should weigh this against management's execution track record and equity compensation structures when evaluating whether leadership interests truly align with shareholders.
Gross Profit and Net Income Margin
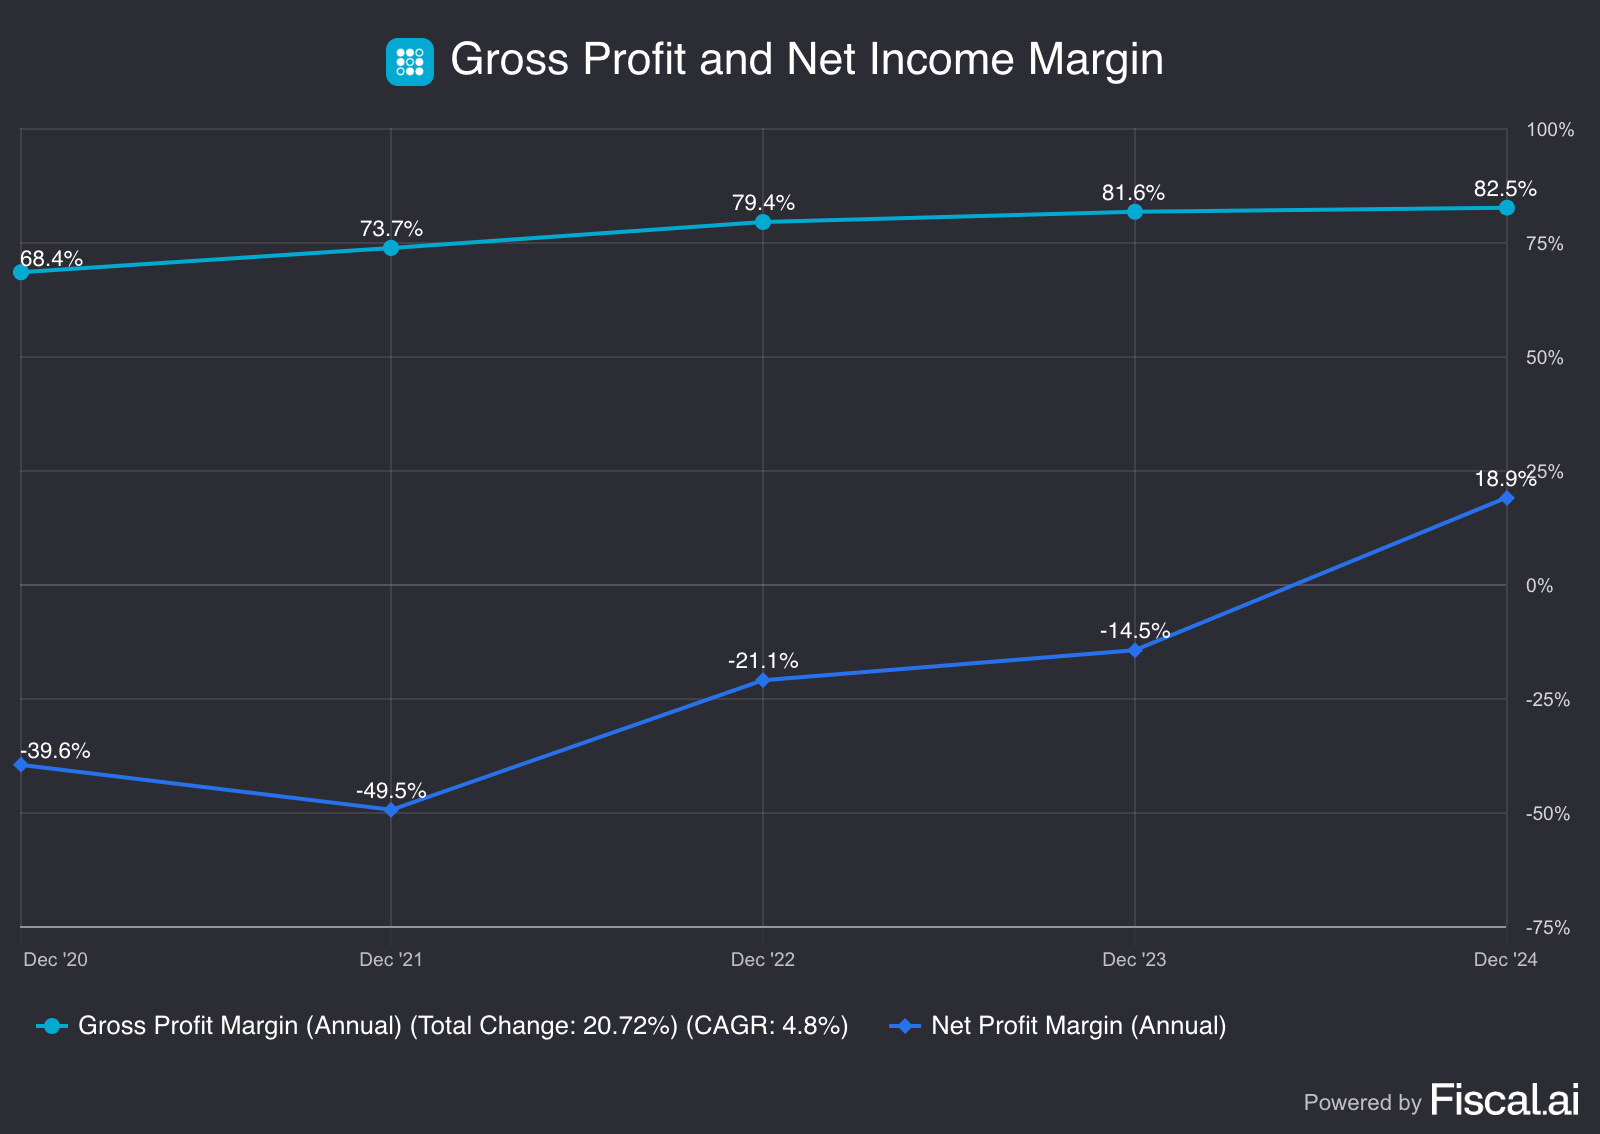
SoFi demonstrated significant operational progress from 2020 to 2024, with both gross profit and net income margins showing substantial improvement.
Gross profit margin grew steadily from 68.4% to 82.5%, reflecting improved operational efficiency and better cost management across the business.
The dramatic turnaround came in net profitability. SoFi moved from deep losses of -39.6% net margin in 2020 to achieving positive net income margin of 18.9% by 2024. The company hit its lowest point in 2021 at -49.5% before steadily climbing toward profitability.
This progression shows SoFi successfully transitioning from a growth-at-all-costs model to sustainable profitability, with the company finally reaching positive net income after years of investment in platform expansion and market share growth.
If you need some more information on SoFi’s Business Model and specifically in-depth information on where most of their revenue is coming from, go and check this article out:

Return on Invested Capital (ROIC)
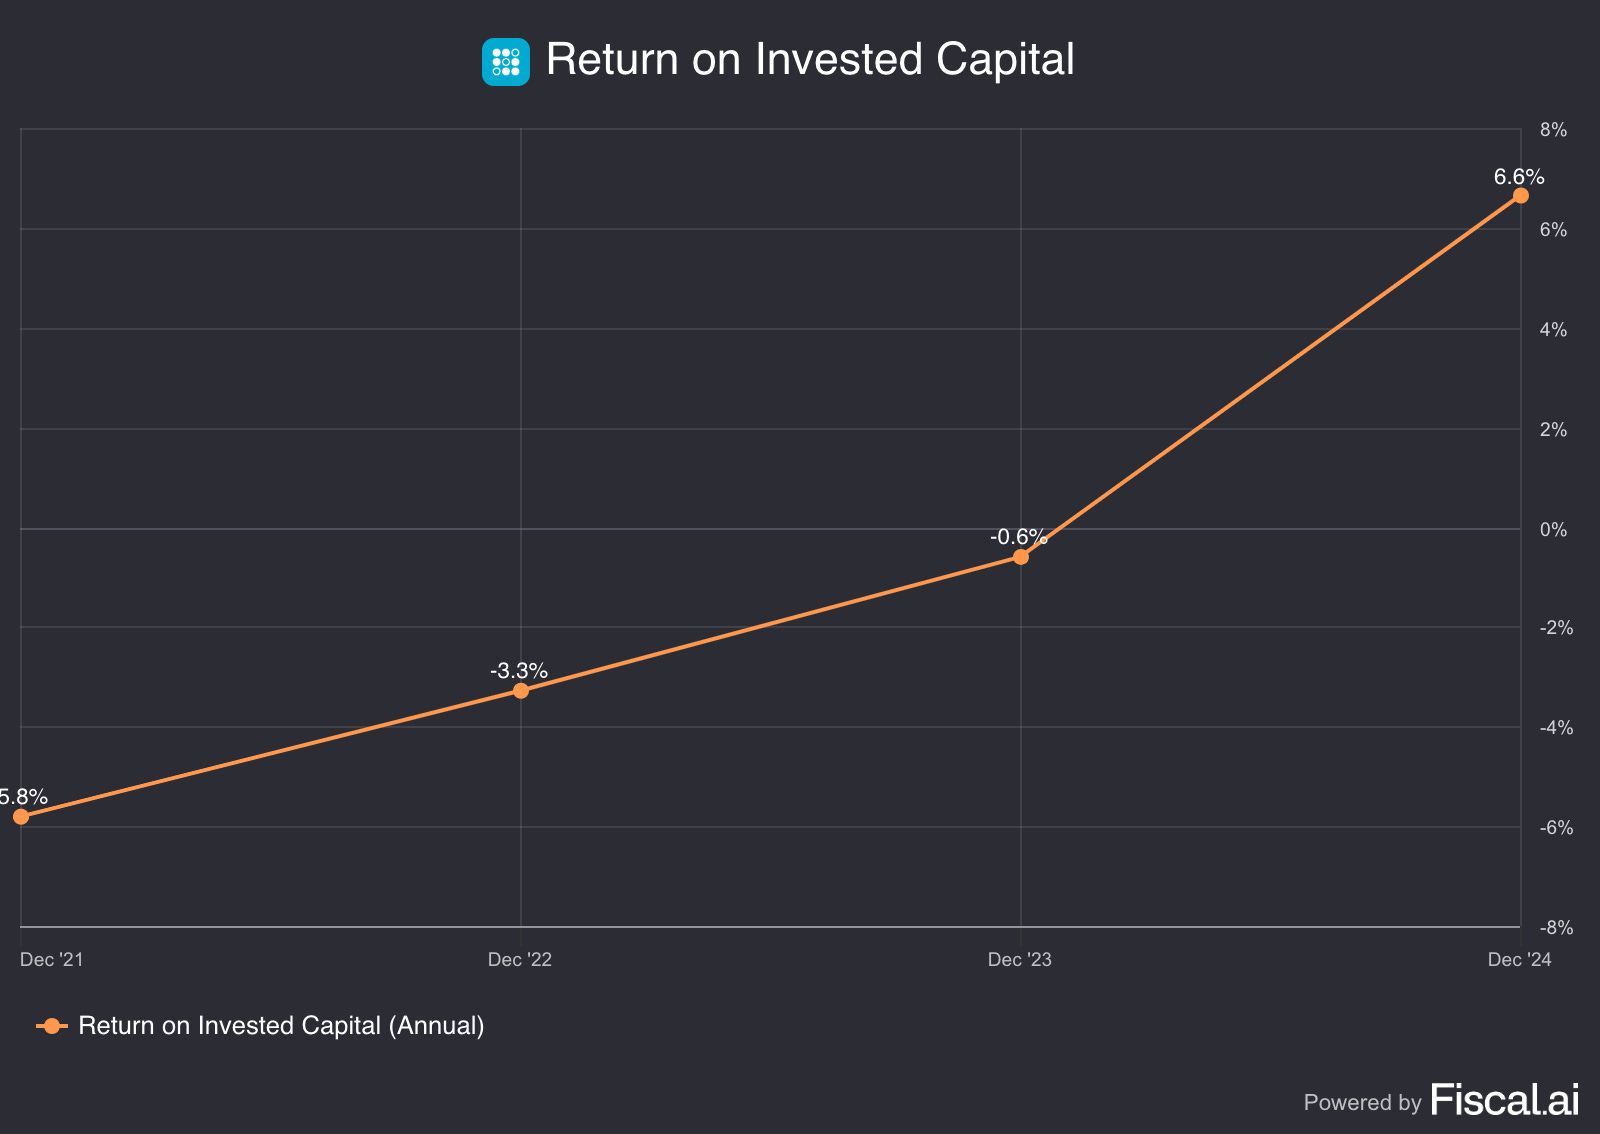
Over the past few years, SoFi’s Return on Invested Capital (ROIC) has declined significantly, indicating that the company is making bad investment decisions.
A 6.6% ROIC is decent but not great, it still suggests weak capital efficiency, allocation and profitability.
It’s important to notice here that even though their ROIC is really weak at this moment, we do expect this number to increase slightly higher in the coming years, because of the expected growth for the business.
Goodwill
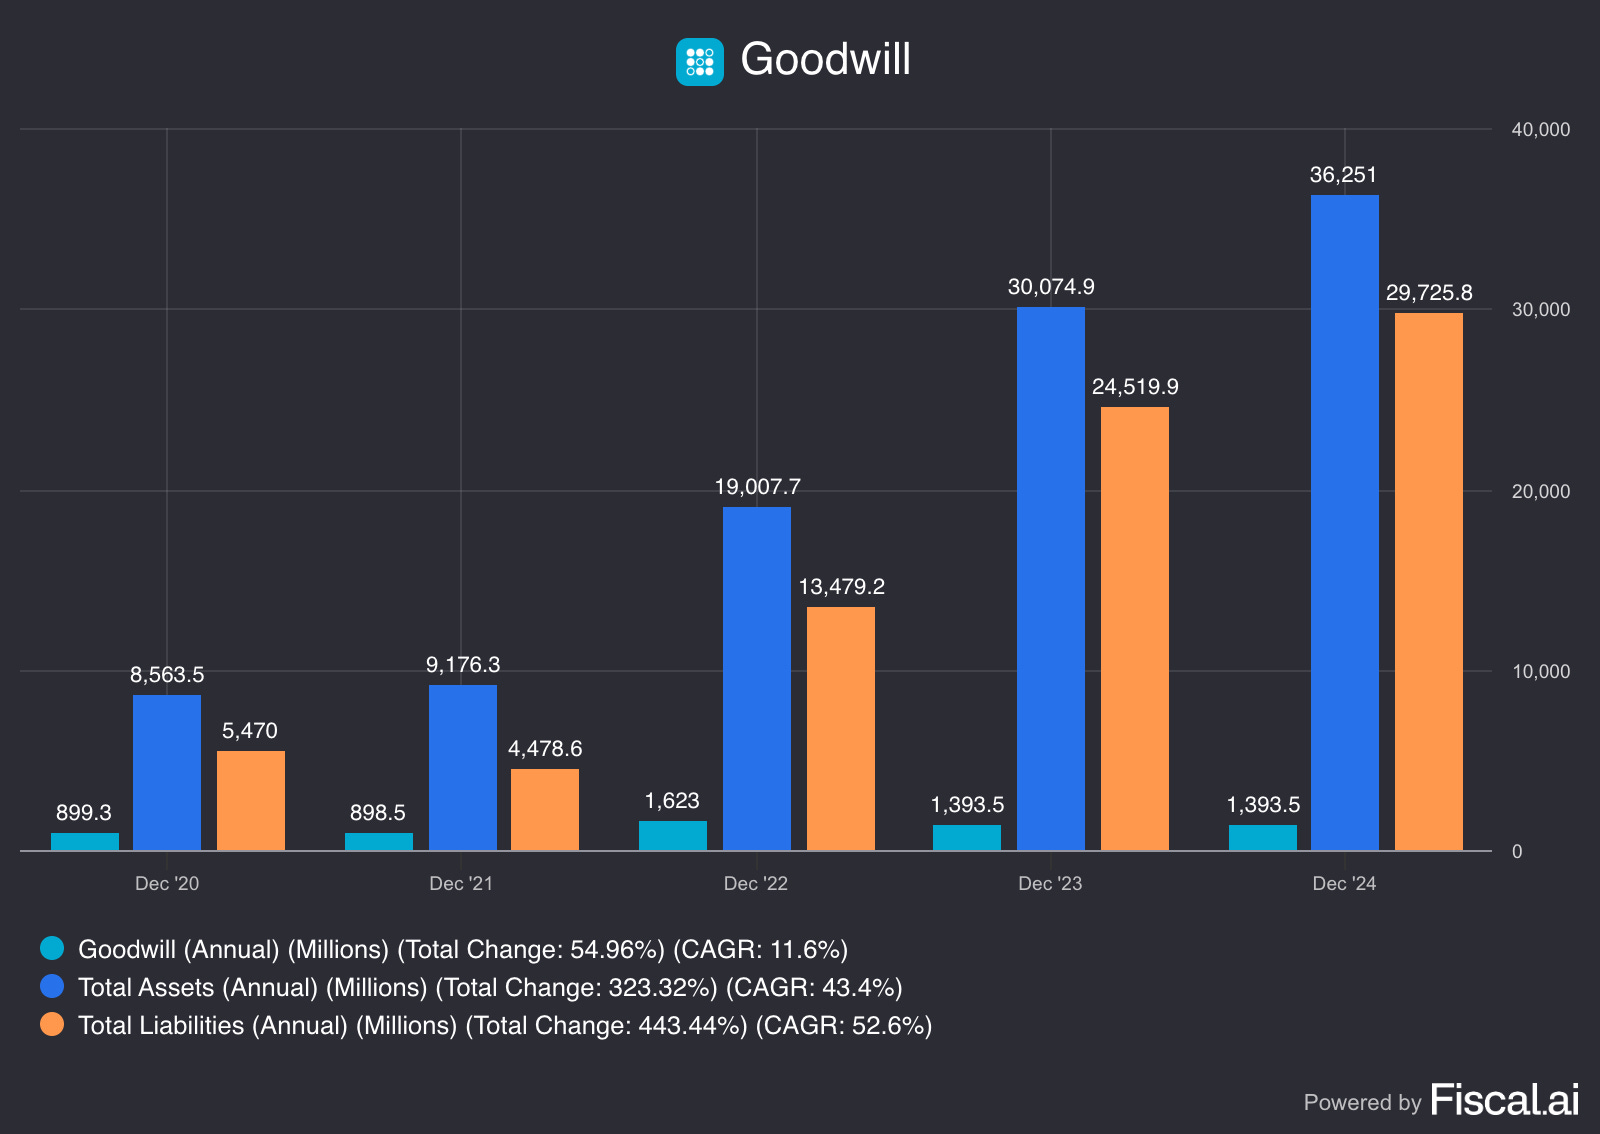
SoFi's balance sheet expanded dramatically from 2020 to 2024, with total assets growing 323% to $36.25 billion, reflecting the company's aggressive scaling and business diversification.
Total liabilities grew even faster at 443% to $29.73 billion, indicating SoFi's increased reliance on debt and deposits to fund its lending operations and growth initiatives.
Goodwill increased 55% to $1.39 billion, suggesting acquisitions played a role in the company's expansion strategy, though it remained relatively stable as a percentage of total assets.
The gap between asset and liability growth rates shows SoFi's leverage increasing over time. While total assets quadrupled, liabilities grew at an even faster pace, indicating the company is funding growth through increased borrowing rather than equity.
This balance sheet evolution reflects SoFi's transformation from a smaller fintech into a full-scale financial services company, though the rising leverage warrants monitoring as the company matures.
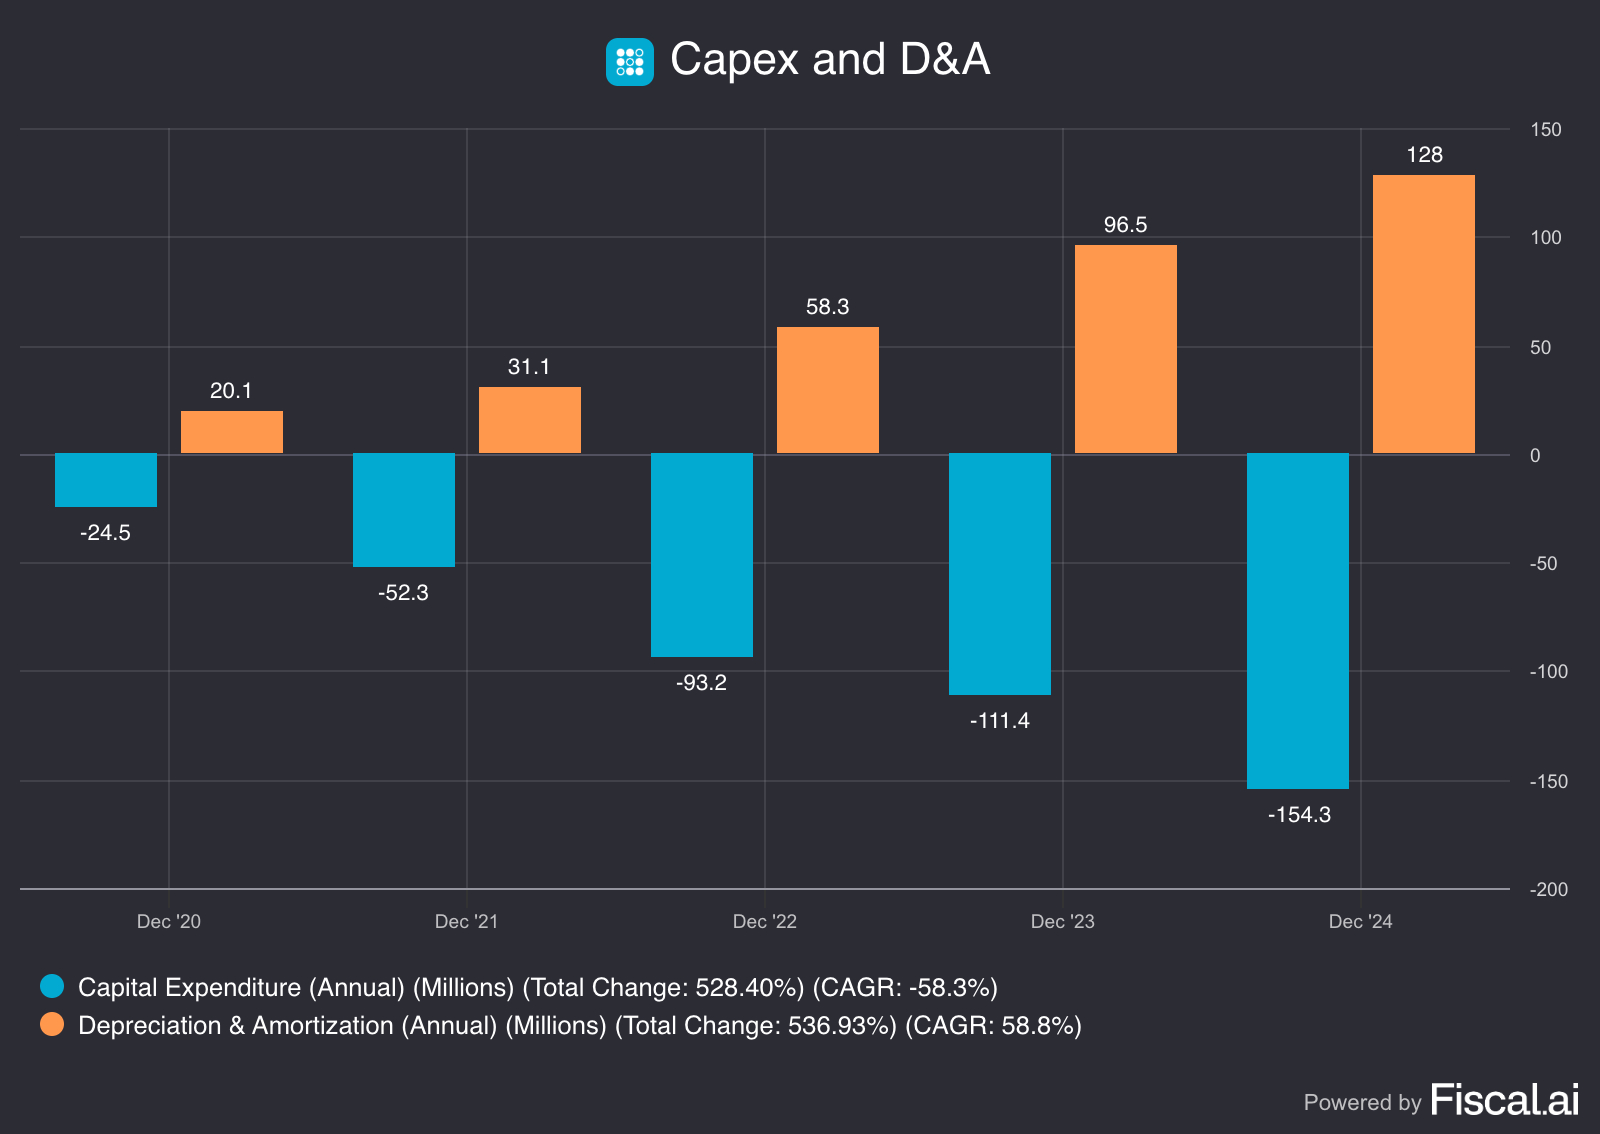
Capex (Maintenance/growth)
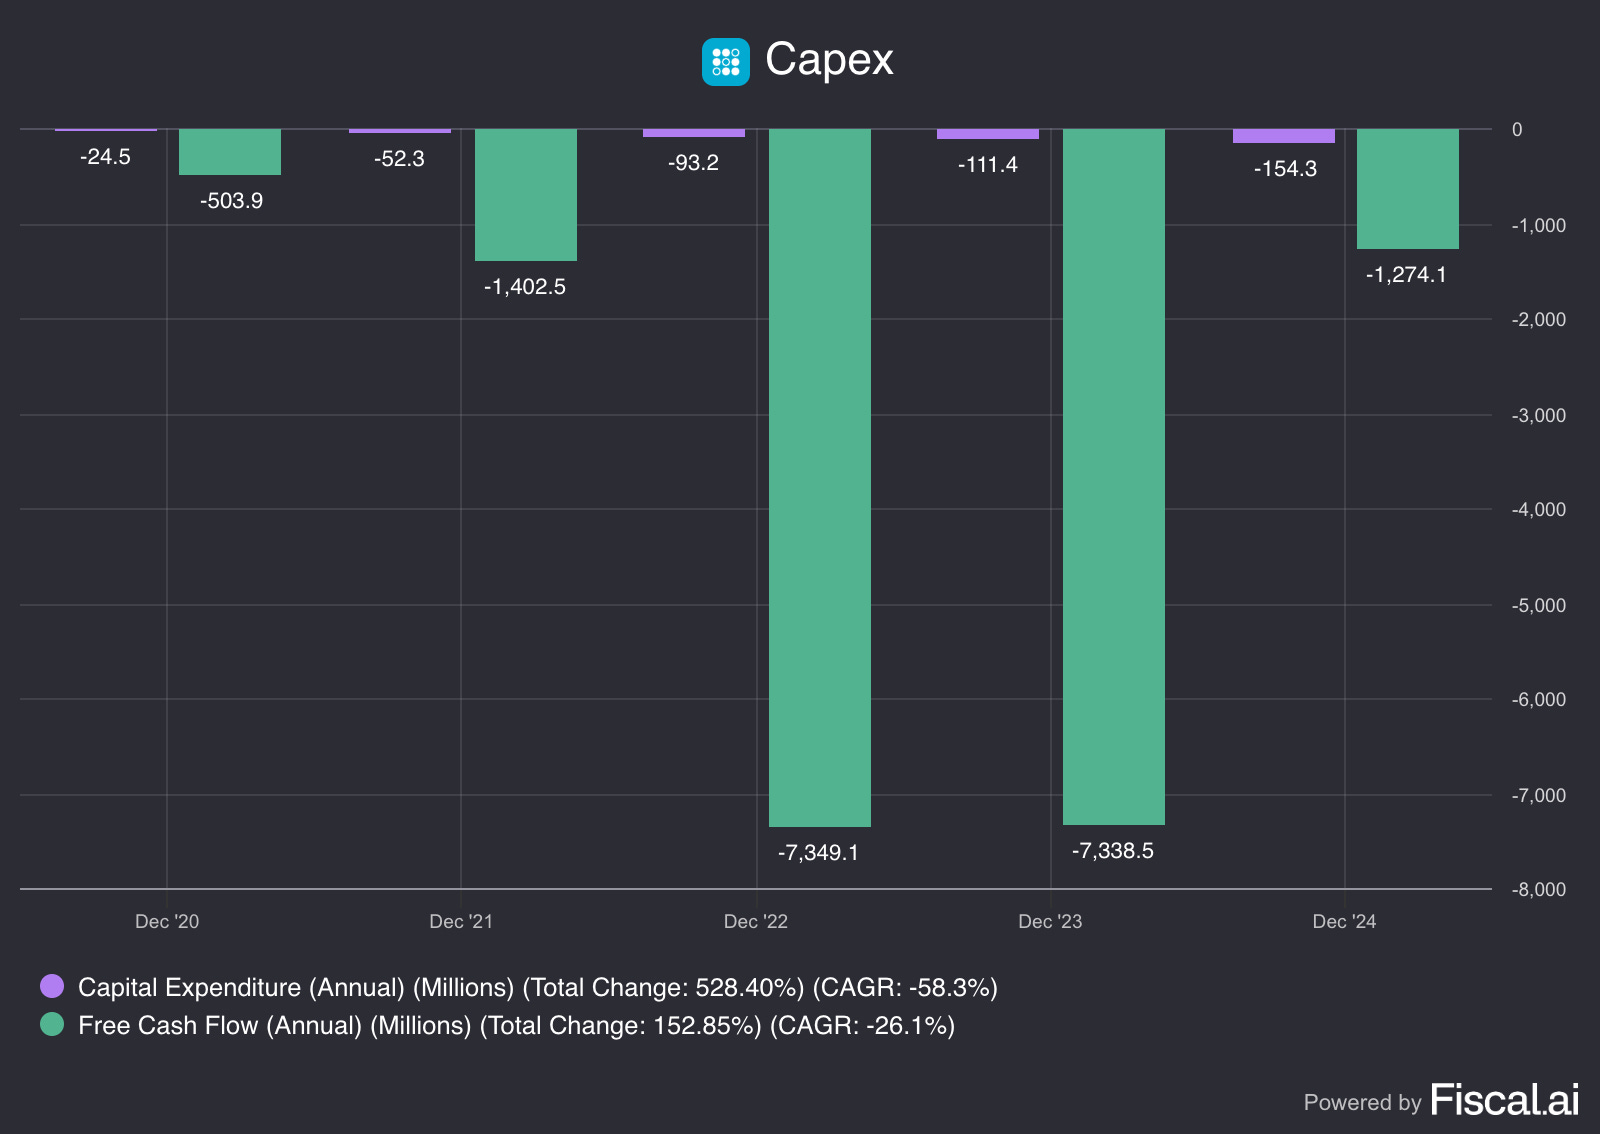
SoFi demonstrated significant improvement in capital allocation from 2020 to 2024, with both capital expenditure and free cash flow trends moving in positive directions.
Capital expenditure increased dramatically from $24.5 million to $154.3 million, representing a 528% growth as SoFi invested heavily in technology infrastructure and platform expansion to support its diversified financial services strategy.
Free cash flow showed substantial improvement, rising from -$503.9 million in 2020 to -$1.27 billion in 2024. While still negative, this represents a 153% improvement trajectory, with the company hitting its worst cash burn of over $7.3 billion in both 2022 and 2023 before recovering significantly.
The relationship between capex and free cash flow suggests SoFi is becoming more capital efficient. Despite higher infrastructure investments, the company dramatically reduced its cash burn, indicating better operational leverage and more disciplined spending as it matures toward profitability.
If you like what you are reading, make sure to SUBSCRIBE so you don’t miss any posts!
Stock Based Compensation
Stock-Based Compensation (SBC) is a non-cash expense which means that it affects financial statements but does not directly impact Free Cash Flow (FCF).
However, it does have indirect effects on a company’s financial health and valuation.
How SBC Affects Free Cash Flow
SBC is Added Back to Operating Cash Flow (OCF):
Since SBC is a non-cash expense, it is deducted from net income on the Income Statement but added back when calculating Operating Cash Flow under the indirect method of cash flow reporting.
This can make FCF appear higher, even though it does not actually generate cash.
Potential Dilution Impact:
While SBC increases FCF in the short term (since it's a non-cash expense), it leads to more outstanding shares over time, which can dilute earnings per share (EPS) and affect stock value.
Investors should be cautious when high SBC artificially boosts FCF while increasing share dilution.
Adjusted Free Cash Flow (Adj. FCF)
To account for SBC’s impact, some investors use an adjusted FCF metric:
Adjusted FCF = FCF − SBC
This adjustment gives a more conservative view of true cash generation by treating SBC as an actual cost to shareholders.
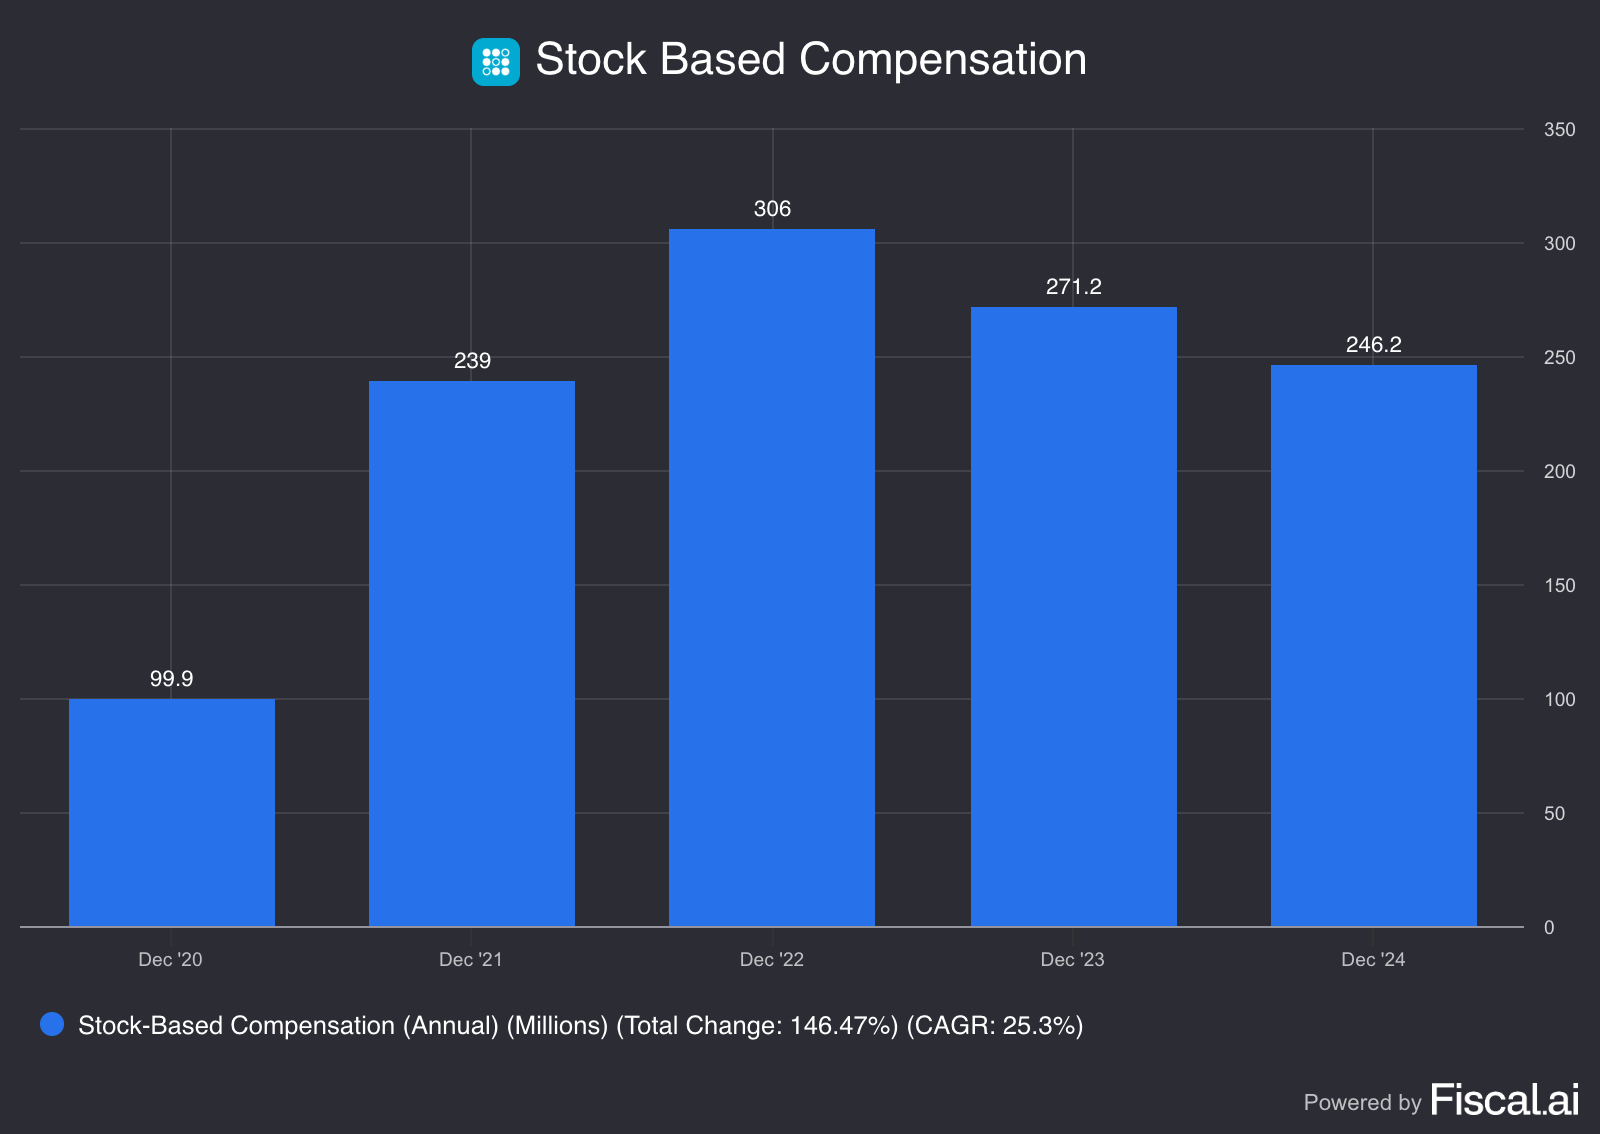
Let’s now take a look at SoFi’s Stock-Based Compensation:
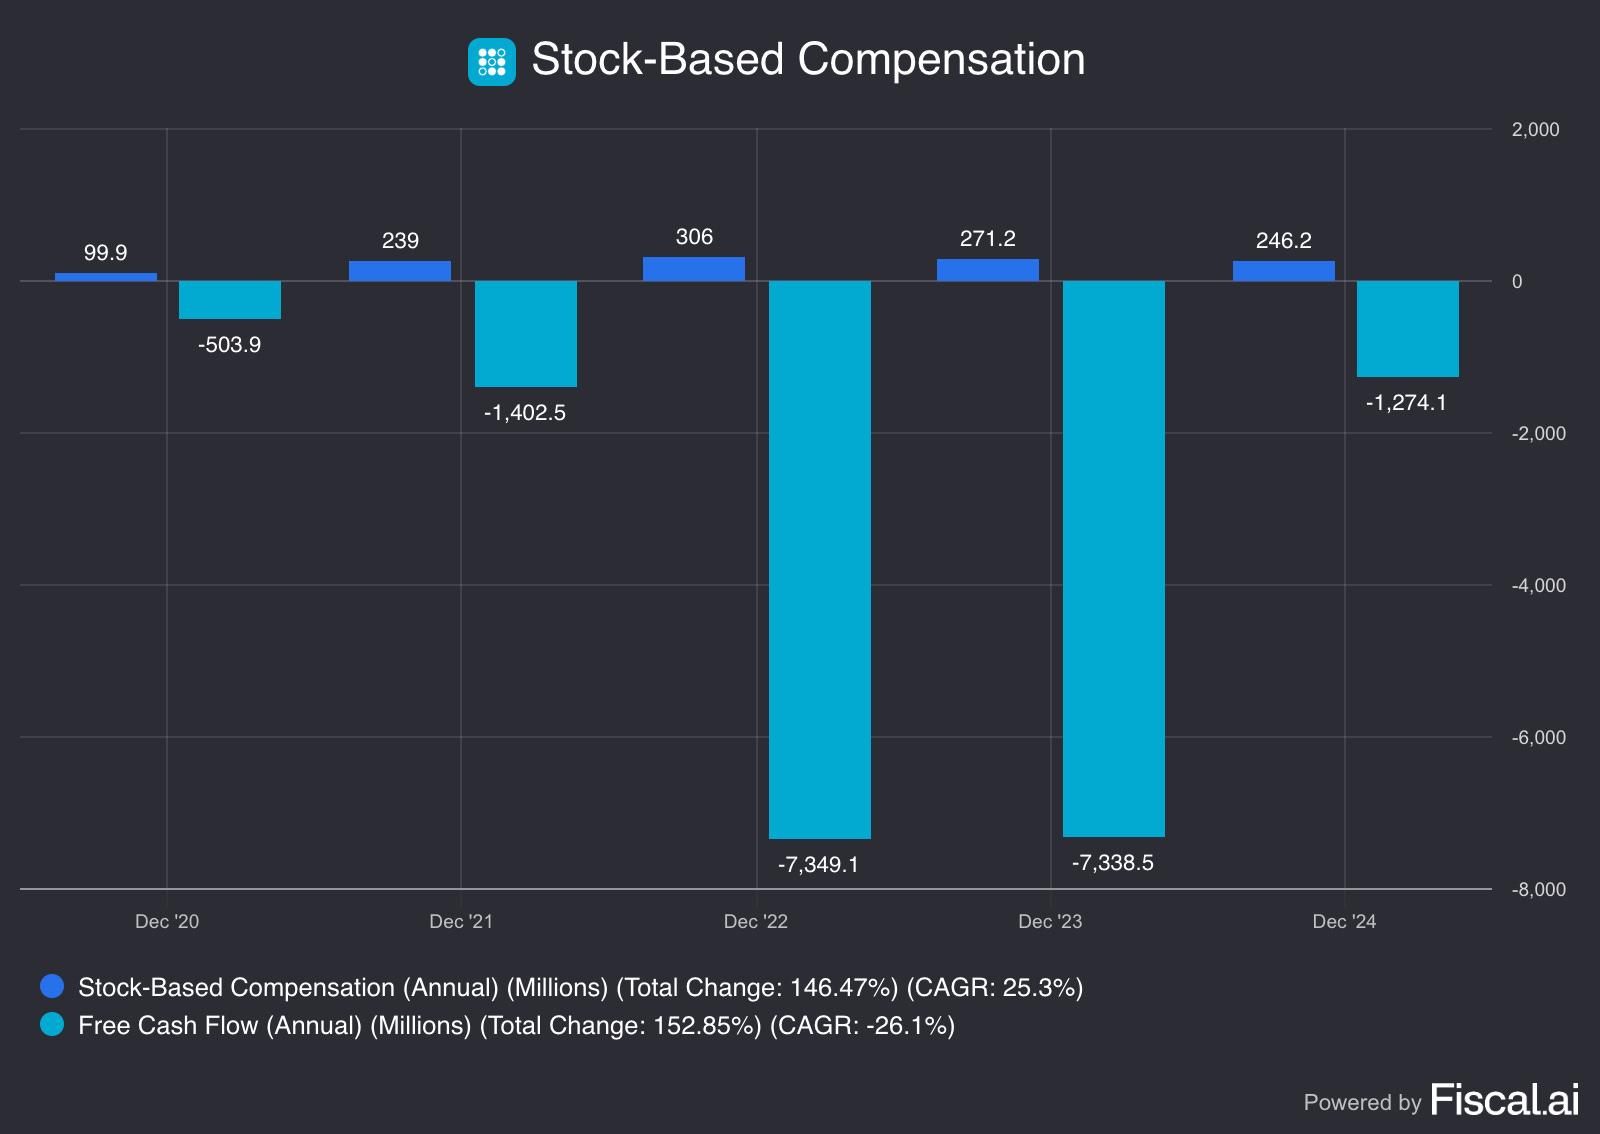
SoFi has been issuing Stock-Based Compensation, which boosts its reported operating cash flow and, consequently, Free Cash Flow.
However, SBC seems to be declining, which is a really good sign.
Additionally, the gap between FCF and SBC is decreasing, indicating that SBC’s impact on FCF is gradually diminishing.
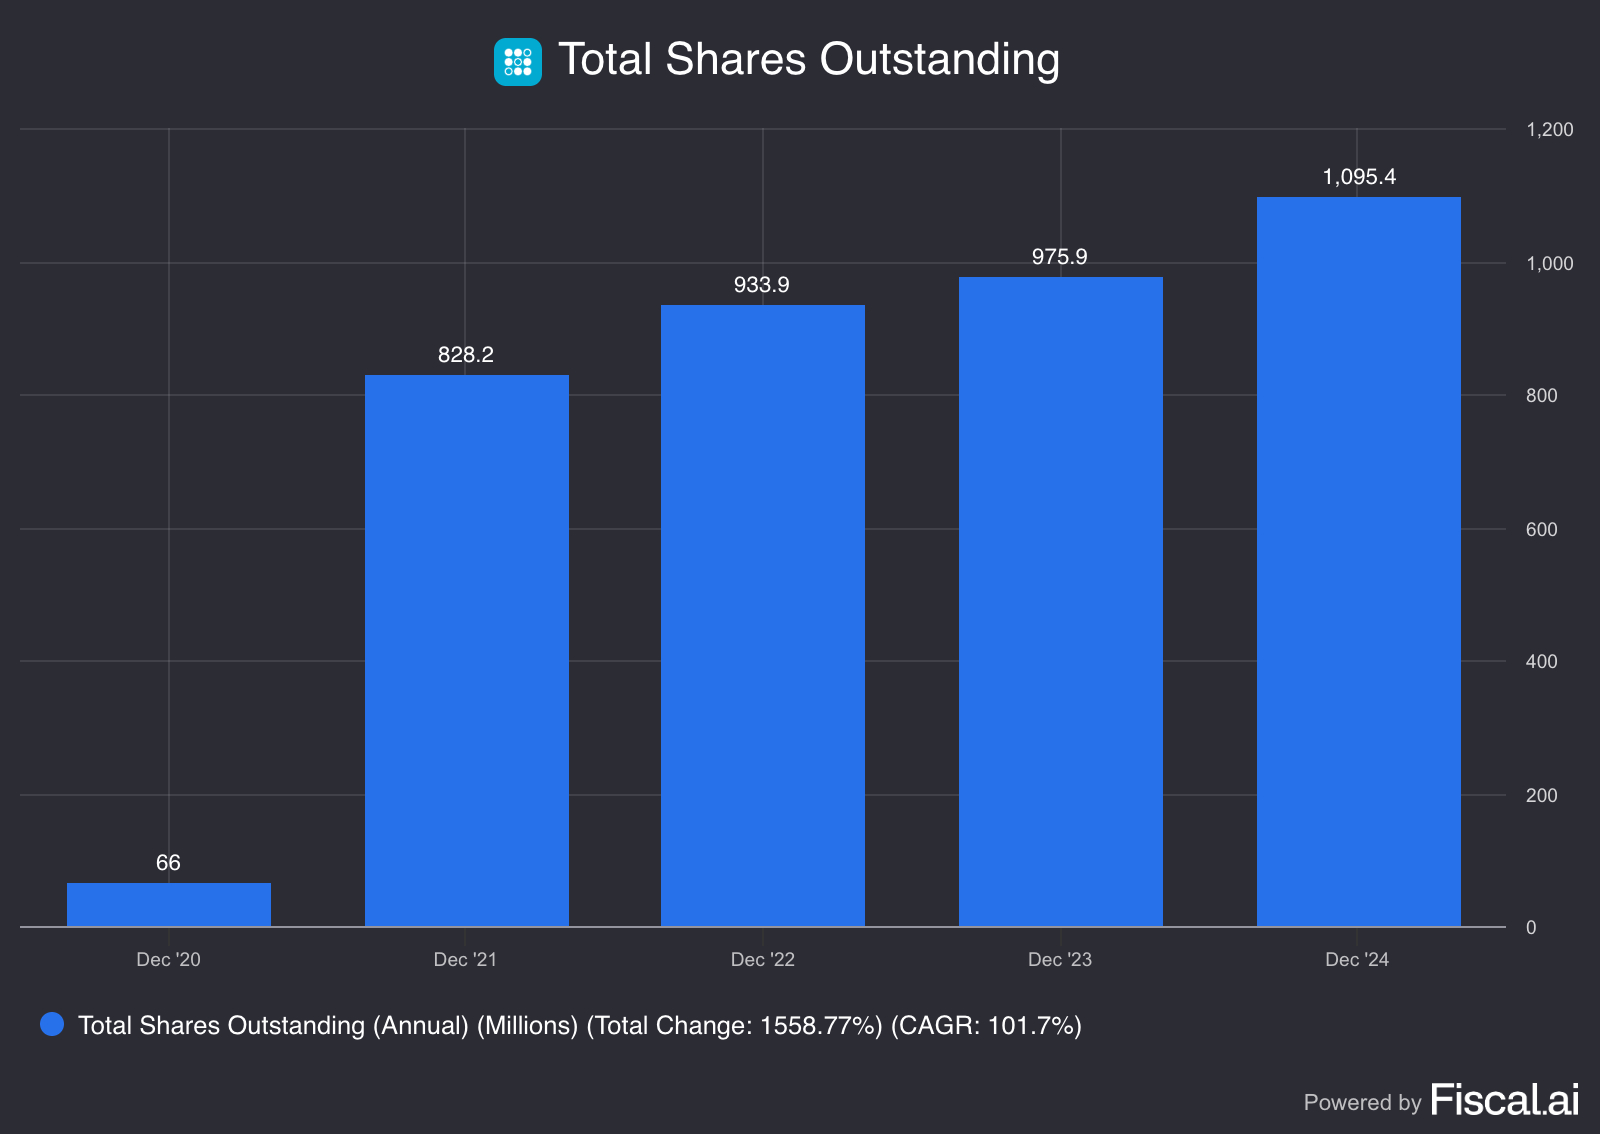
Buybacks
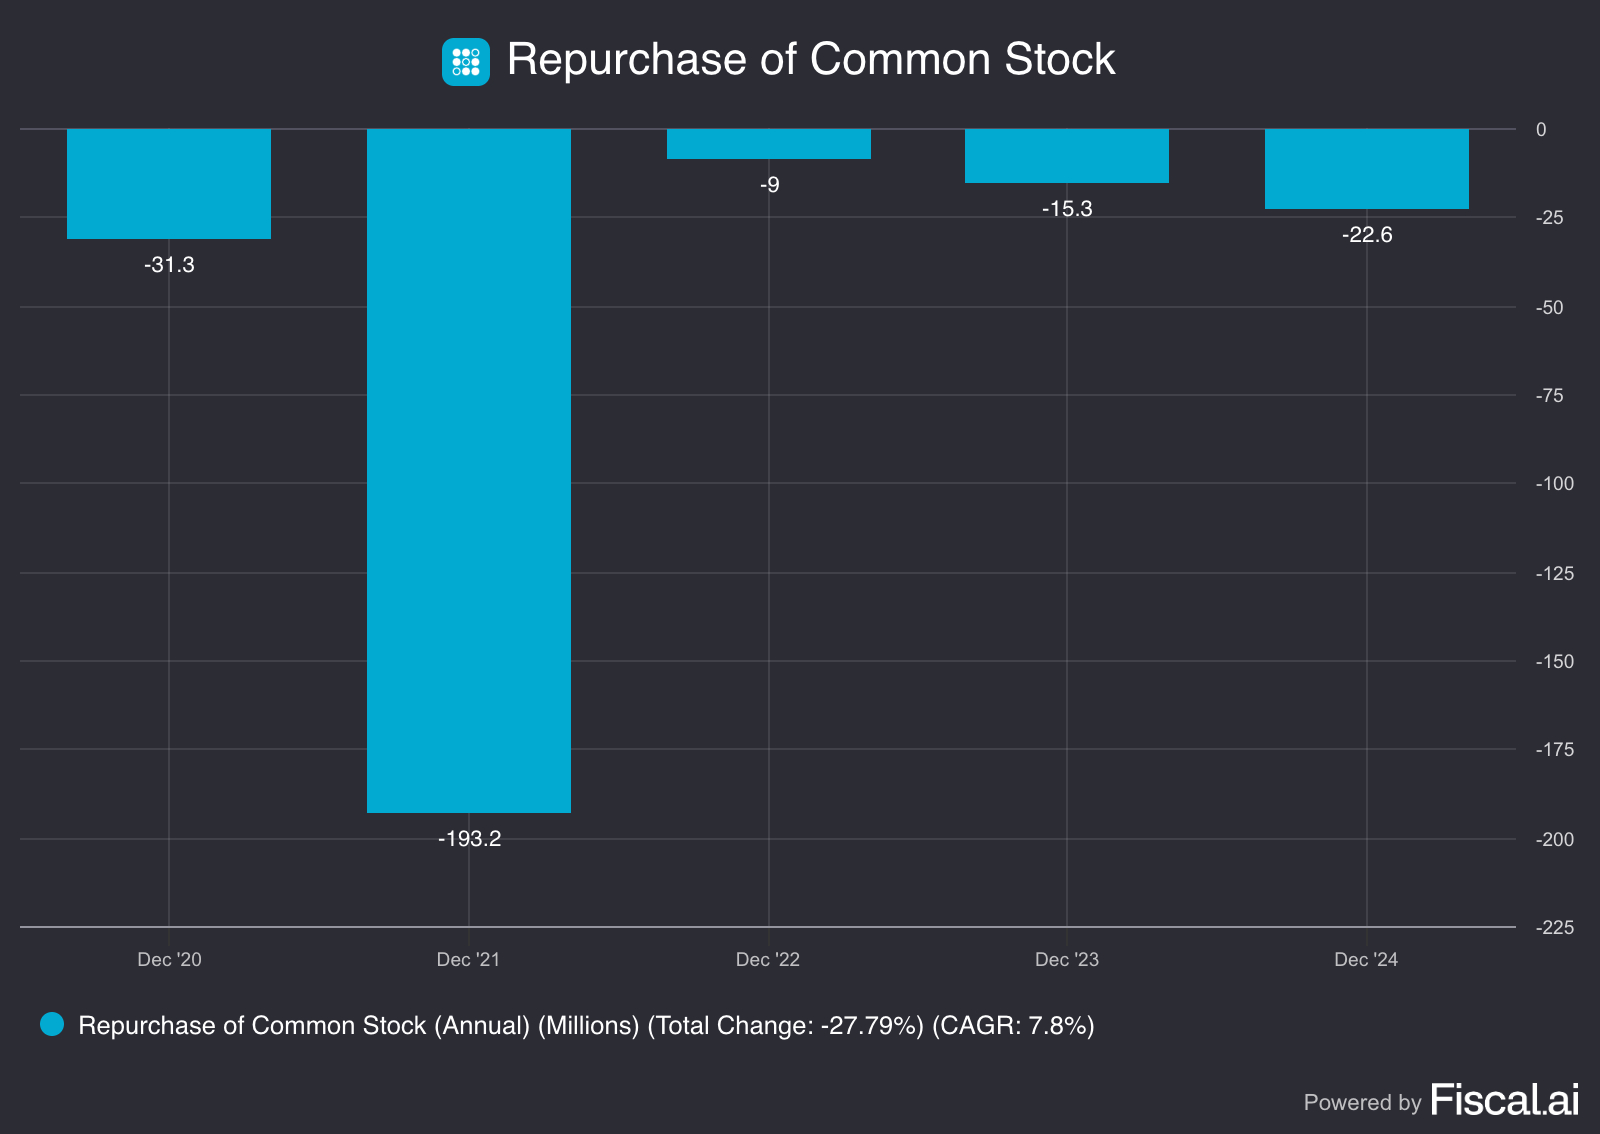
It appears that SoFi does repurchase shares, it has been repurchasing shares since 2020. Last year, they bought back around 22.6 million shares out of a total of 1.1 billion shares.
It doesn't seem like they currently have a formal share buyback program, or at least I couldn’t find any specific information on it.
As an investor, share buybacks are generally seen as a positive sign because they can increase the value of the shares you currently own. They often indicate management’s confidence in the company’s future and can help drive long-term shareholder value.
If I’m being honest, I’m not the biggest fan of buybacks. I believe companies could put that money to better use by investing in initiatives that genuinely strengthen the business. Rather than spending cash on buybacks, they could focus on areas that drive long-term growth and create real value. But hey, I’m just a simple investor, what do I know?
Forward P/E
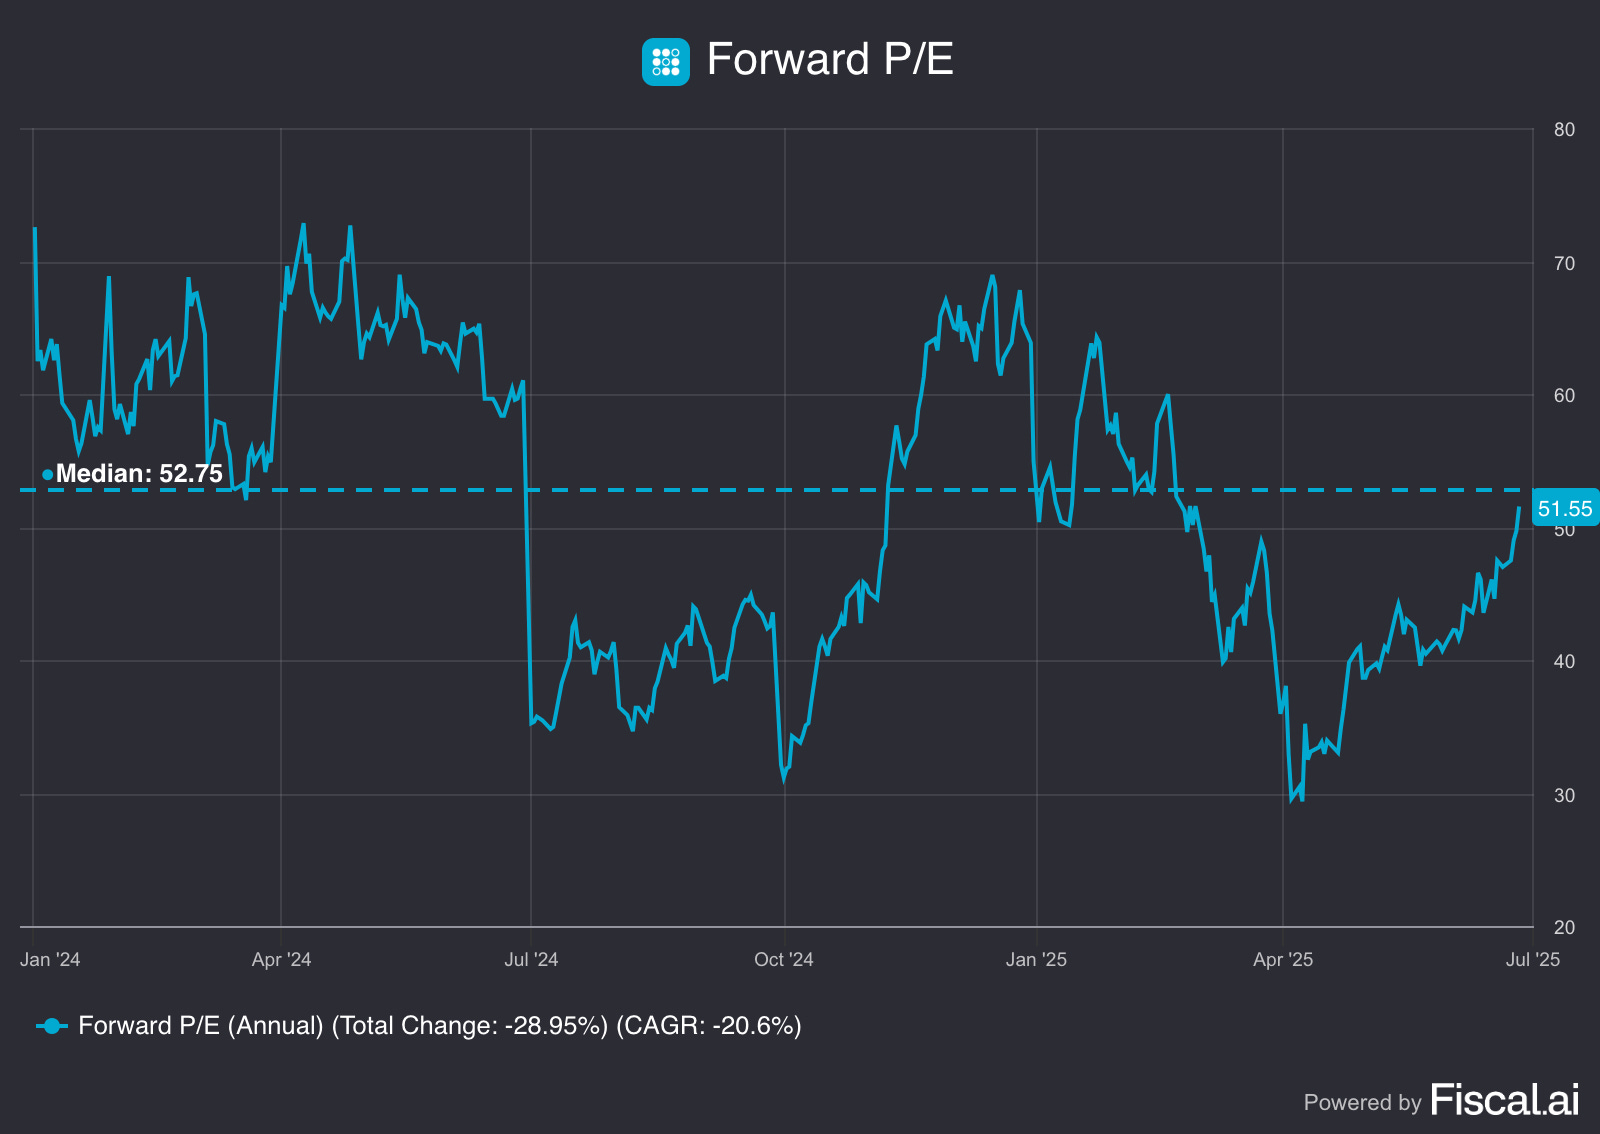
SoFi's forward P/E ratio has been highly volatile over the past 18 months, fluctuating dramatically between roughly 30 and 75 times earnings while maintaining a median of 52.75.
The stock experienced significant valuation swings, with forward P/E peaking above 70 in early 2024 and again around late 2024/early 2025, followed by sharp corrections that brought valuations down to the low 30s.
Currently trading near 51.55, SoFi's forward P/E sits close to its median level, suggesting the stock may be approaching fair value after periods of both overvaluation and undervaluation.
The 29% total decline in forward P/E over the period, despite the high volatility, indicates that earnings expectations have generally improved faster than the stock price has risen, reflecting SoFi's progression toward sustainable profitability and more reasonable valuation multiples for a maturing fintech company.
When I look at the Forward P/E, I always compare it to the stock’s historical median to get a sense of whether it’s undervalued or overvalued. But it’s also key to remember that this ratio is based on earnings, so if earnings are going down, the multiple can be pretty misleading. A low P/E might look attractive, but it doesn’t mean much if the business is struggling underneath.
SoFi’s forward P/E is trading below its historical median, suggesting the stock may currently be undervalued based on this metric.
Forward P/FCF
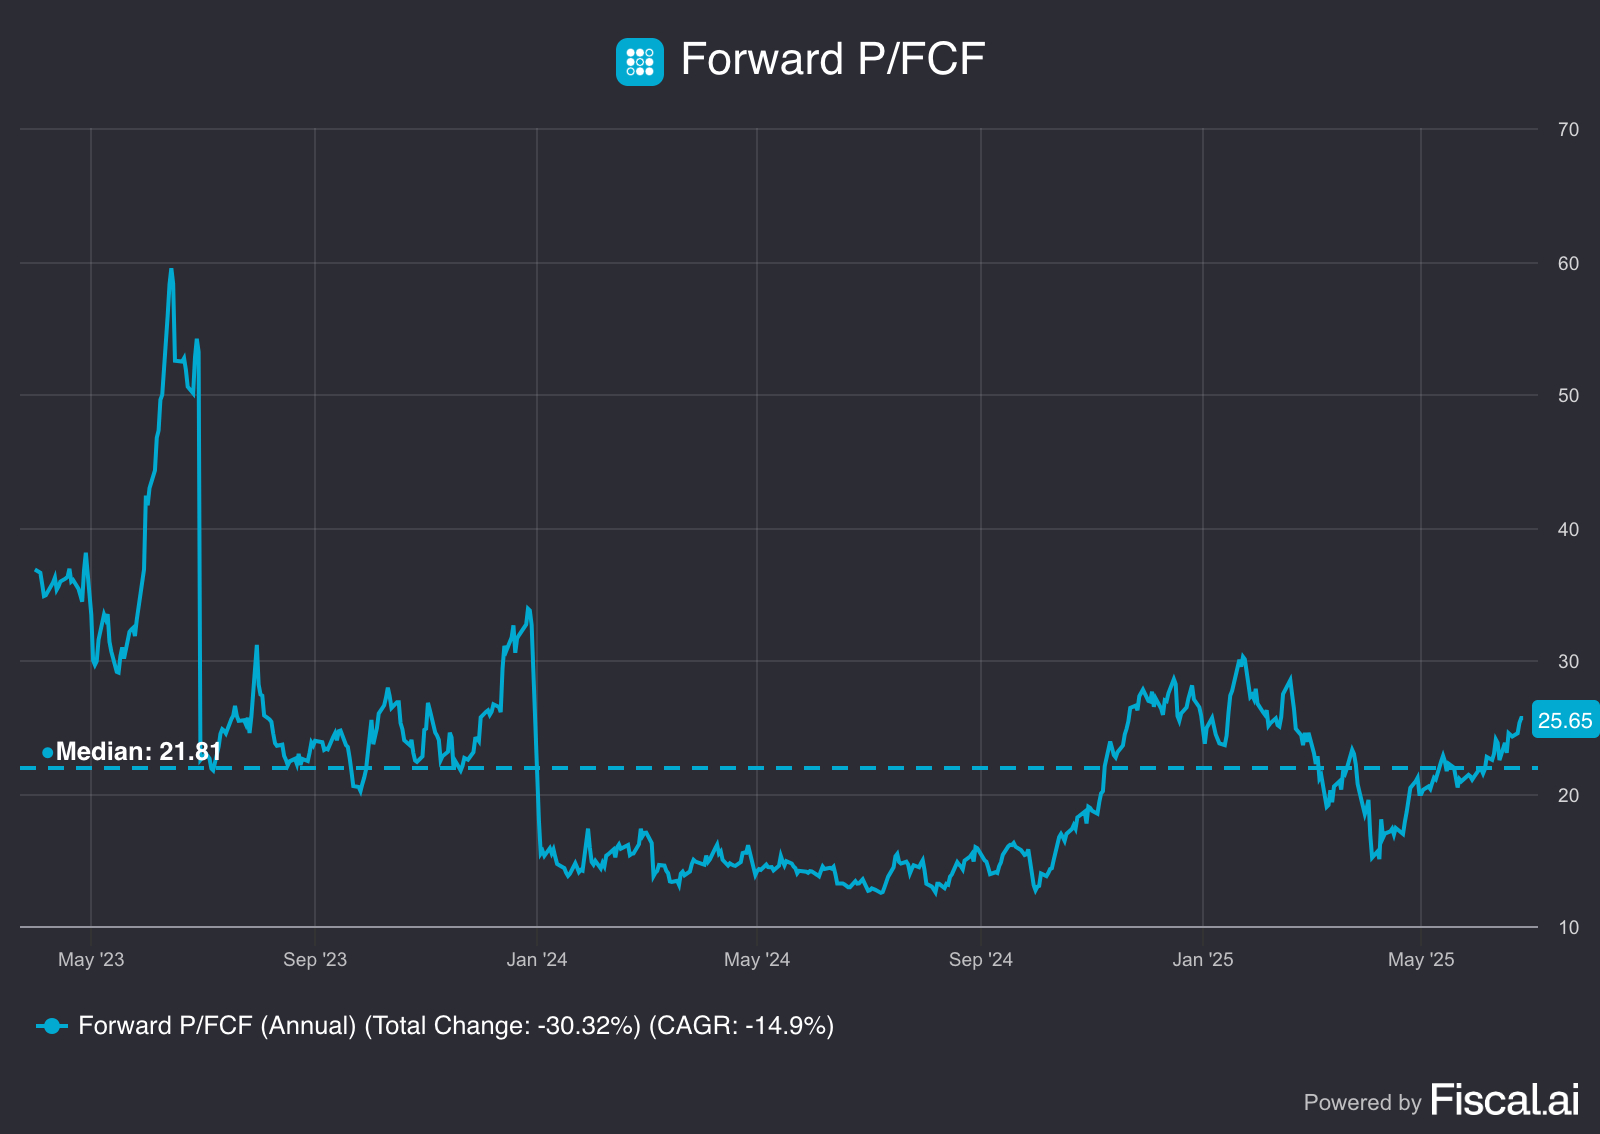
The Forward Price-to-Free Cash Flow ratio has exhibited significant volatility throughout the May 2023 to May 2025 period, currently positioned at 25.65x compared to the historical median of 21.81x.
The metric reached its peak valuation of approximately 60x in mid-2023, followed by a substantial correction that established a trading range between 20-30x for the majority of the observation period.
A notable compression phase occurred in early 2024, driving the Forward P/FCF to cycle lows near 15x, before recovering to current levels through a gradual upward trajectory. Despite recent stabilization, the overall performance reflects a total decline of 30.32% with a compound annual growth rate of -14.9%, indicating fundamental improvement in free cash flow generation relative to market valuation.
The current reading above the historical median suggests normalization following the extreme volatility of 2023, with the metric now operating within reasonable valuation parameters based on the established trading range.
When I look at the Forward P/FCF, I always compare it to the stock’s historical median to get a sense of whether it’s undervalued or overvalued. But it’s also key to remember that this ratio is based on free cash flows, so if free cash flows are going down, the multiple can be pretty misleading. A low P/FCF might look attractive, but it doesn’t mean much if the business is struggling underneath.
SoFi’s forward P/FCF is trading above its historical median, suggesting the stock may currently be overvalued based on this metric.
If you like what you are reading, make sure to SUBSCRIBE so you don’t miss any posts!
Earnings Growth Model
This model tells us the yearly expected return based on growth of the earnings and shareholder yield.
The formula looks like the following:
Expected return = EPS growth + dividend yield +/- multiple expansion (contraction)Here are the assumptions I use:
EPS Growth = 43% per year over the next 10 years
Dividend Yield = / (there is no dividend)
Forward PE to increase from 51x (current) to 52x (median) over the next 10 years
Expected return = 43% + 0 + 0.1*((52-51)/51))= 43.2%So, this means that we should be happy with a return of 43.2% per year.
In case of a more conservative EPS growth: a 30% EPS growth, we get the following:
Expected return = 30% + 0 + 0.1*((52-51)/51))= 30.2%With an estimated 15% EPS growth, we should expect a 30.2% return per year.
Reverse DCF
A reverse DCF is very easy to execute.
When looking at this model, you only need to know 3 main things:
The current stock price of the company
The number of shares outstanding
The Free Cash Flow in Year 1
Next to the following three things, you also need the following:
Perpetuity Growth rate: growth rate after year 10
Use 3% ( this the average growth of the global economy)
Discount rate: The % used to discount future cash flows to today, accounting for risk and time
Discount rate = a proxy for our expected return
20% (the expected return, it’s important to notice that if you adjust this the impact will be huge on the model) (for a growth stock I expect at least a 20% return per year)
With a discount rate of 20%, you can expect a yearly return of 20% as an investor
Let’s use this model for SoFi.
SoFi
Let’s look into a Reverse DCF for SoFi.
We need to know three things:
The current stock price of the company
The number of shares outstanding
The Free Cash Flow in Year 1
The current stock price as of the 27th of June is:
$16.74
The number of shares outstanding are:
1.095 billion
The Free Cash Flow in Year 1
$647 million (expected FCF for 2025)
Two adjustments need to be made to SoFi’s FCF:
Subtract Stock-Based Compensation (cost for shareholders)
Add Growth CAPEX
Stock-Based Compensation
Stock-based compensation is a cost for shareholders.
As a result, we subtract it from SoFi’s FCF.
SoFi’s Stock-Based Compensation = $246 million
Adding Growth Capex
A distinction can be made between Maintenance Capex and Growth Capex:
Maintenance Capex: Investments made in existing assets
Growth Capex: Investments made in new assets in order to grow
When a company invests a lot in future growth, its growth capex is very high but these investments should create a lot of value in the long term.
As a rule of thumb, we state that the company’s maintenance capex equals Depreciation & Amortiziation.
Capex = Maintenance Capex + Growth Capex
Maintenance Capex = Depreciation & Amortiziation
Growth Capex = Total Capex - Depreciation & Amortiziation
Capex = $154 million
Depreciation & Amortization = $128 million
Now that we have the following numbers, we can calculate the Growth Capex:
Growth Capex = Total Capex - Depreciation & Amortization
Growth Capex = $154 million - $128 million
Growth Capex = $26 million
As we know the Free Cash Flow, Stock-Based Compensation and Growth CAPEX, we can now calculate the adjusted Free Cash Flow we use in our model:
Adjusted FCF = FCF - SBC + Growth Capex
Adjusted FCF = $647 million - $246 million + $26 million
Adjusted FCF = $427 million
Excel Spreadsheet
Now we go to our Excel spreadsheet and fill in all the information.
Our input looks as follows:

The only thing we still need to do is click the ‘Calculate Growth Rate’ button.
After you click it, you get the following:

But, what does this mean?
Look at the growth rate (year 1-10) in green.
This number shows you how much SoFi’s FCF should grow in the next 10 years to generate a return of 20% per year for you as a shareholder.
SoFi needs to grow its FCF by 42,01% per year to generate an annualised return of 20%.
Is this realistic?
Let’s look at two things:
The historical FCF Growth of SoFi
Analysts’ expectations
Historical FCF Growth
The evolution of SoFi’s FCF looks as follows:
As you can see in the chart above, SoFi has quite a fluctuating Free Cash Flow growth. Therefore, I will not be using this stat to compare with the reverse DCF model. And I will just look at the numbers that analysts are referring to.
Analysts’ expectations
Now we are going to look into what analysts expect from SoFi in the years ahead.
EPS isn’t the same as FCF, but we use it as a proxy because FCF estimates aren’t available.
As you can see below, analysts expect SoFi to grow its FCF (/EPS) by 43% per year.

Is SoFi overvalued or undervalued?
Now, let’s determine whether SoFi is overvalued or undervalued.
Expectations implied in the current stock price (Reverse DCF): 42,01%
→ SoFi should grow its FCF by 42,01% per year to generate a return of 20% per year for you as an investor.
Is this realistic?
→ Analysts expect SoFi to grow its FCF by 43% per year in the years ahead.
The numbers suggest that SoFi is slightly undervalued at its current price, though not by a wide margin. Considering the full picture, I would rate SoFi as a Hold for now.
2. Technical Analysis
In this second section, I’ll cover a short Technical Analysis on SoFi.

As shown in the chart, SoFi’s price is currently trading near a resistance level around $17,71. I’ve identified a BUY zone between $10,45 and $8,25.
Based on the current price action, SoFi appears to be in a non clear territory meaning that there has to be more price action to confirm the next potential move up.
(So, right now this doesn’t look appealing to Buy. I would prefer to buy them back at previous levels or buy at current levels when we see them testing these levels again.)
If you enjoyed reading this breakdown article, you might enjoy these other breakdowns to:


Thank you for reading this article! If you enjoyed reading it, make sure to SUBSCRIBE so you don’t miss out any posts! And share, leave a comment!
Disclaimer: Here
Exceptional deep dive! Very happy to have you back writing on Substack!
Great analysis - thanks for the hard work !