


Celsius: The Better Red Bull Alternative
A Fundamental and Technical Analysis.


So, today we’ll discuss whether Celsius seems like a stock to keep an eye on or not.
Overview
Today, I’ll cover the following for Celsius:
Fundamental Analysis
Technical Analysis
This is also the framework that I’ll be using when doing a proper Deep Dive into a company’s Fundamentals and Technicals that might be a possible BUY.
If you’re interested in seeing more of these Deep Dives where I discuss a companies Fundamentals and Technicals, make sure to SUBSCRIBE so you don’t miss any FREE insights!
1. Fundamental Analysis
In the next section, I’ll discuss the following things:
General Overview (Total Revenues, Net Income, EBITDA, Free Cash Flow)
KPI’s
Skin in the game
Gross Profit and Net Income Margin
ROIC
Goodwill
Capex (Maintenance/growth)
Stock Based Compensation
Buybacks
Forward P/E
Forward P/FCF
Forward EV/EBITDA
General Overview
In this first part, I’ll discuss the overall fundamentals of the business: Total Revenues, Net Income, EBITDA, Free Cash Flow.
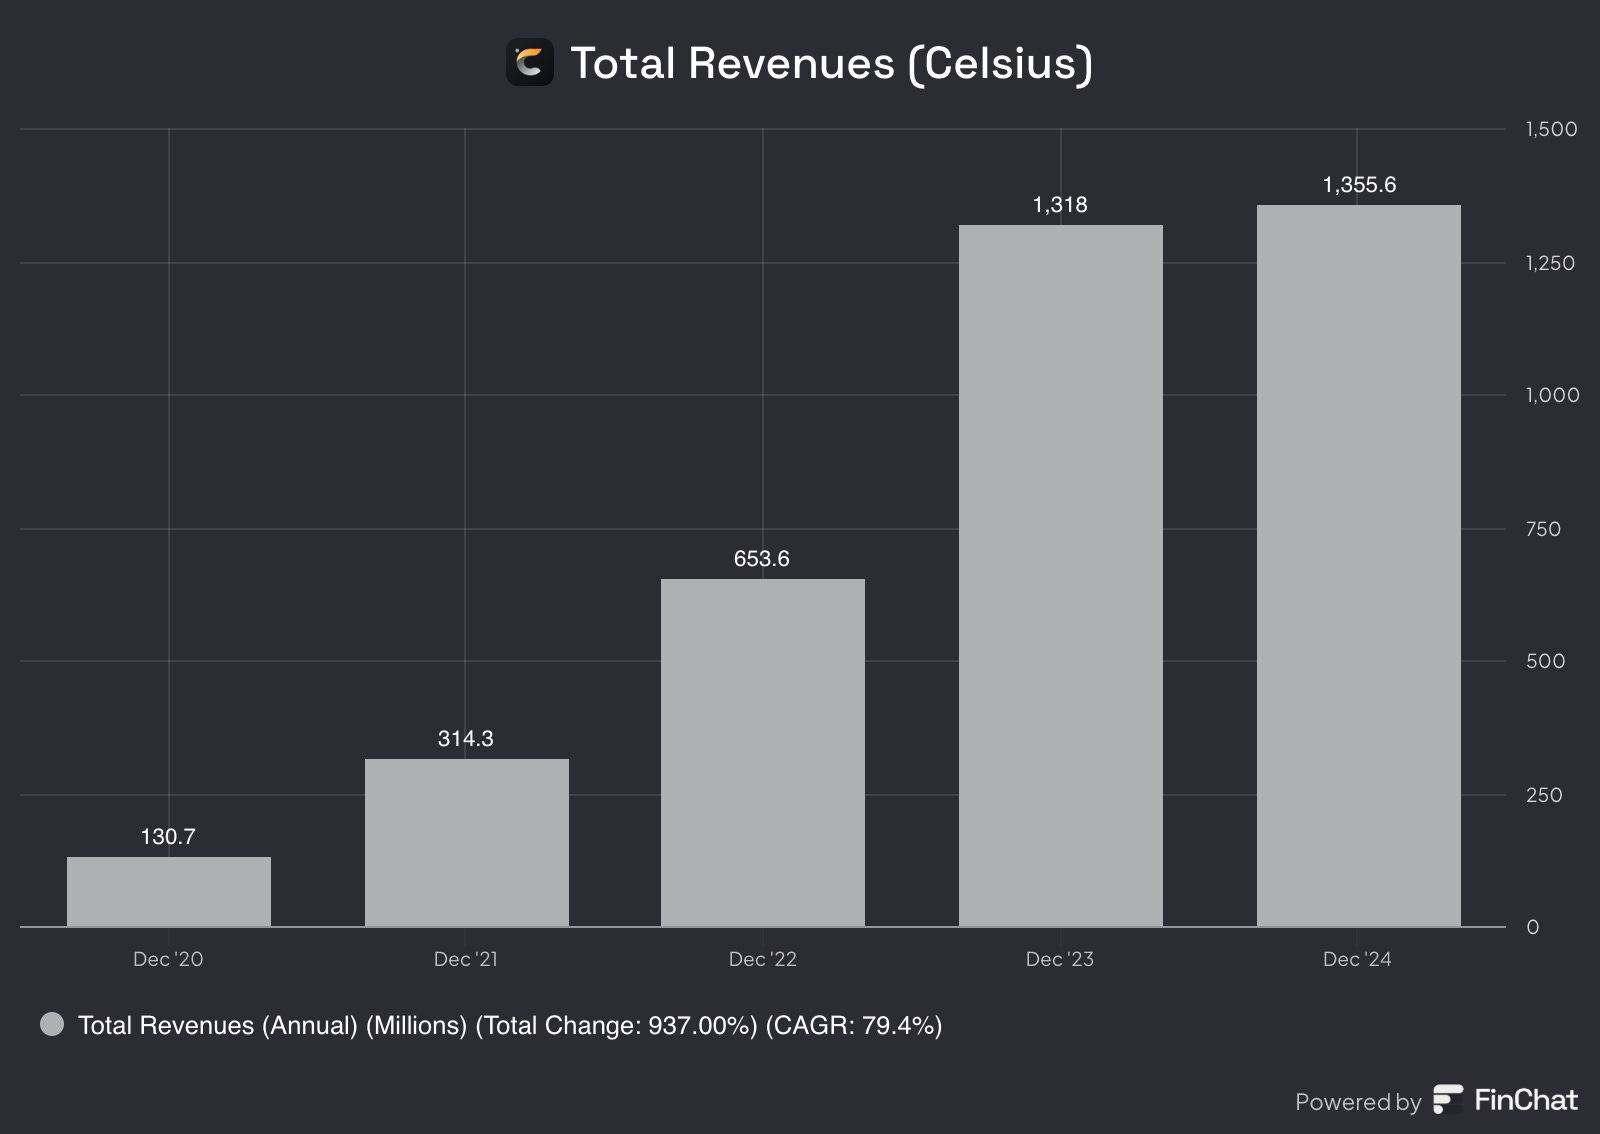
Total Revenues
Total revenues appear to be growing rapidly, with a CAGR of 79% over the past five years. This is a strong indicator of Celsius’ strength. While revenue growth in the past year has slowed, the company still maintains significant expansion. Looking ahead, revenue is expected to rise further, driven by their acquisition of Alani Nu.
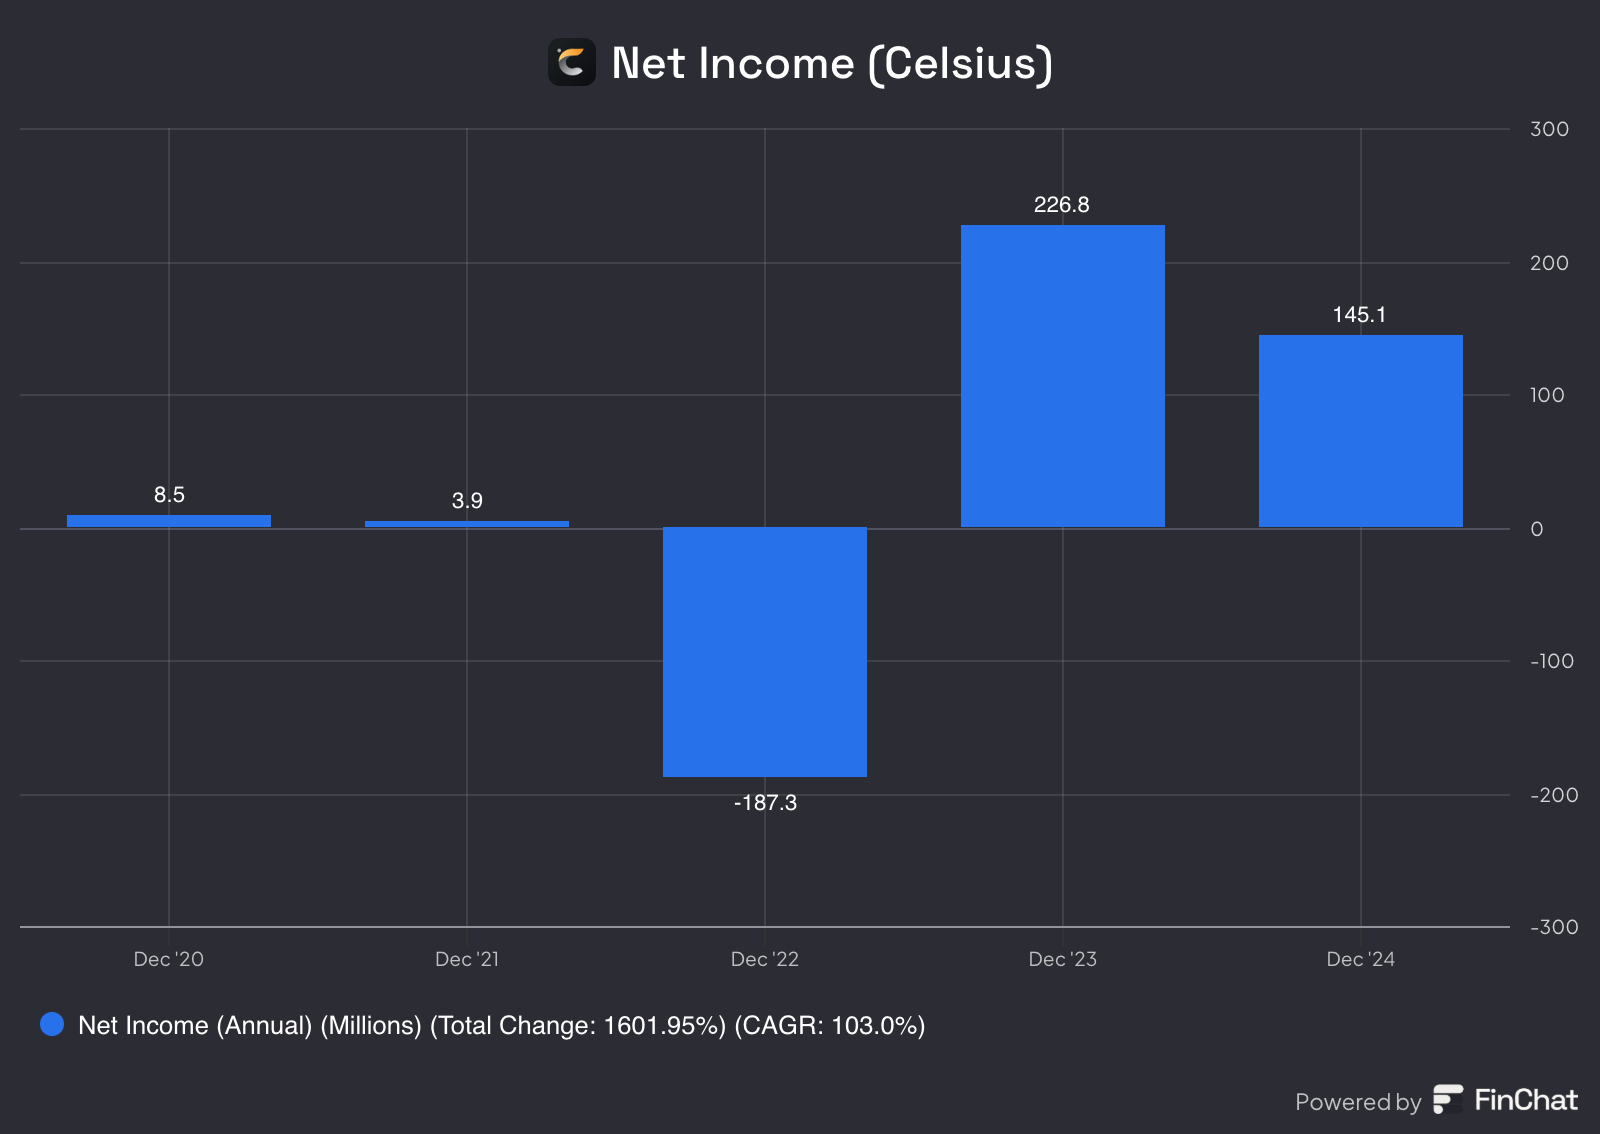
Net Income
Over the last five years, Celsius has seen significant growth in its net income. While the company initially reported a loss back in 2022, it has since then steadily transitioned to being profitable. This positive trend highlights their ability to scale efficiently and manage costs, positioning them for sustained financial success as they continue expanding their market presence.
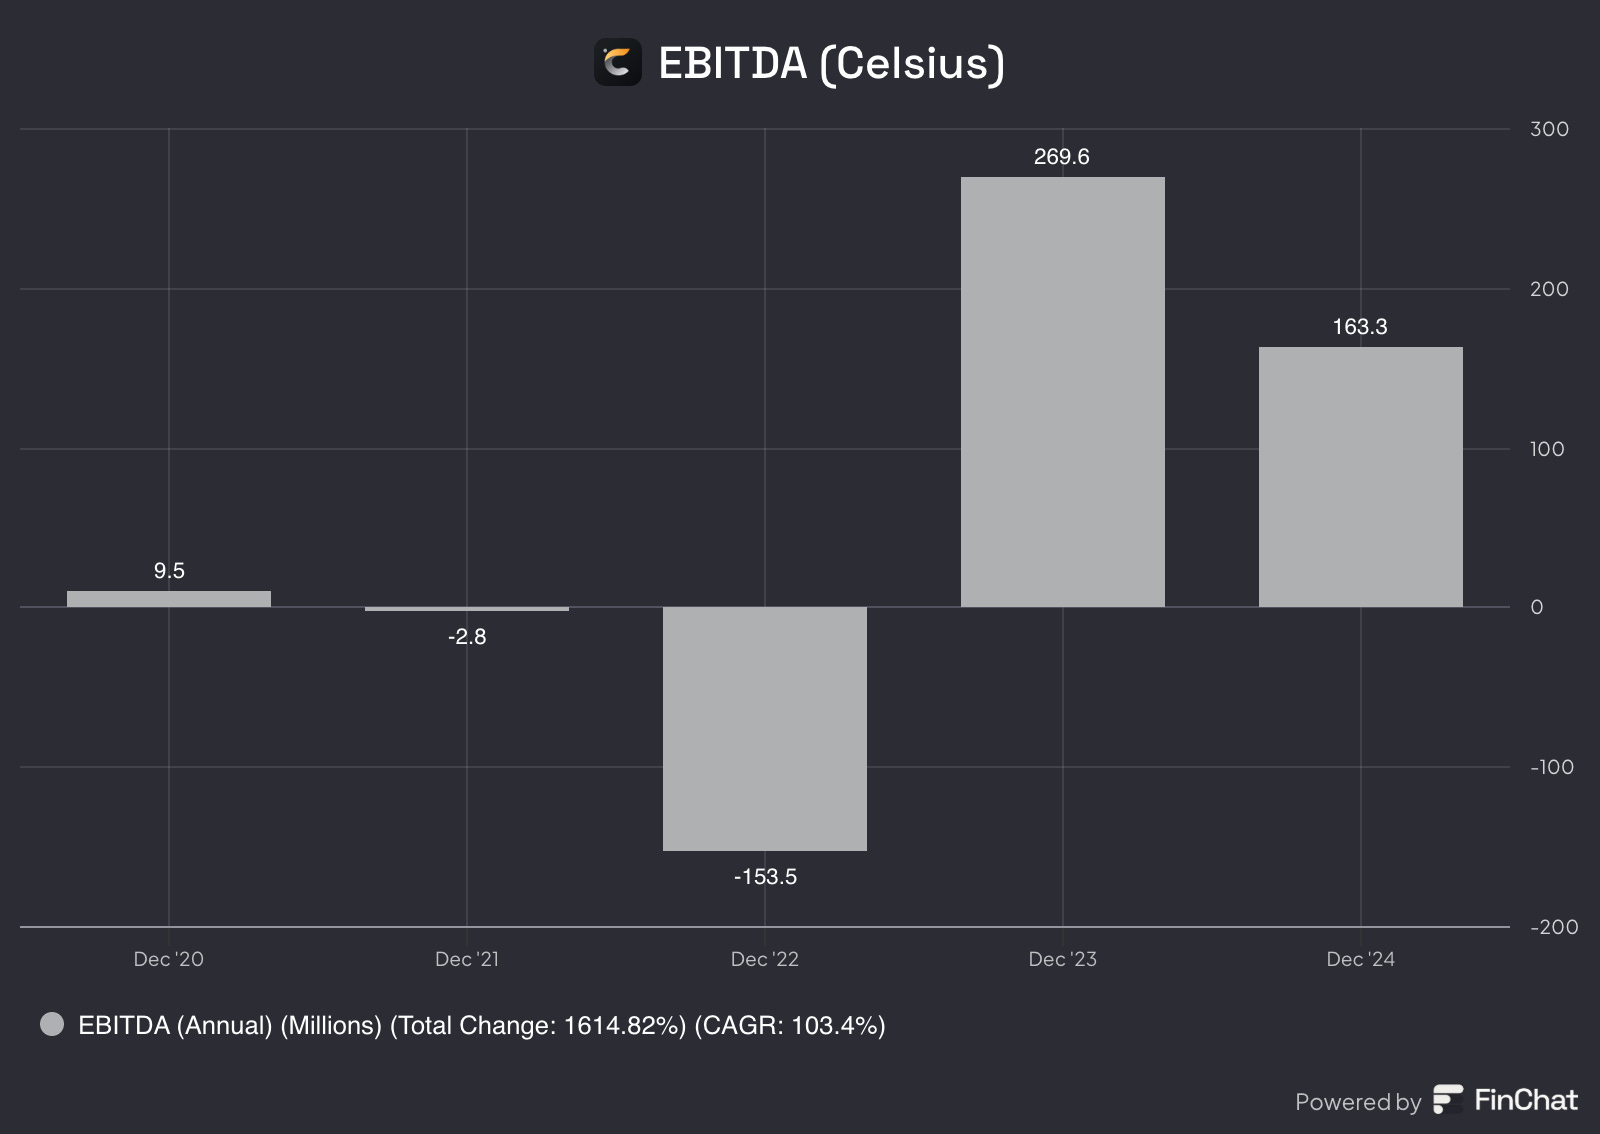
EBITDA
The same can be said about Celsius' EBITDA. As you can see here:
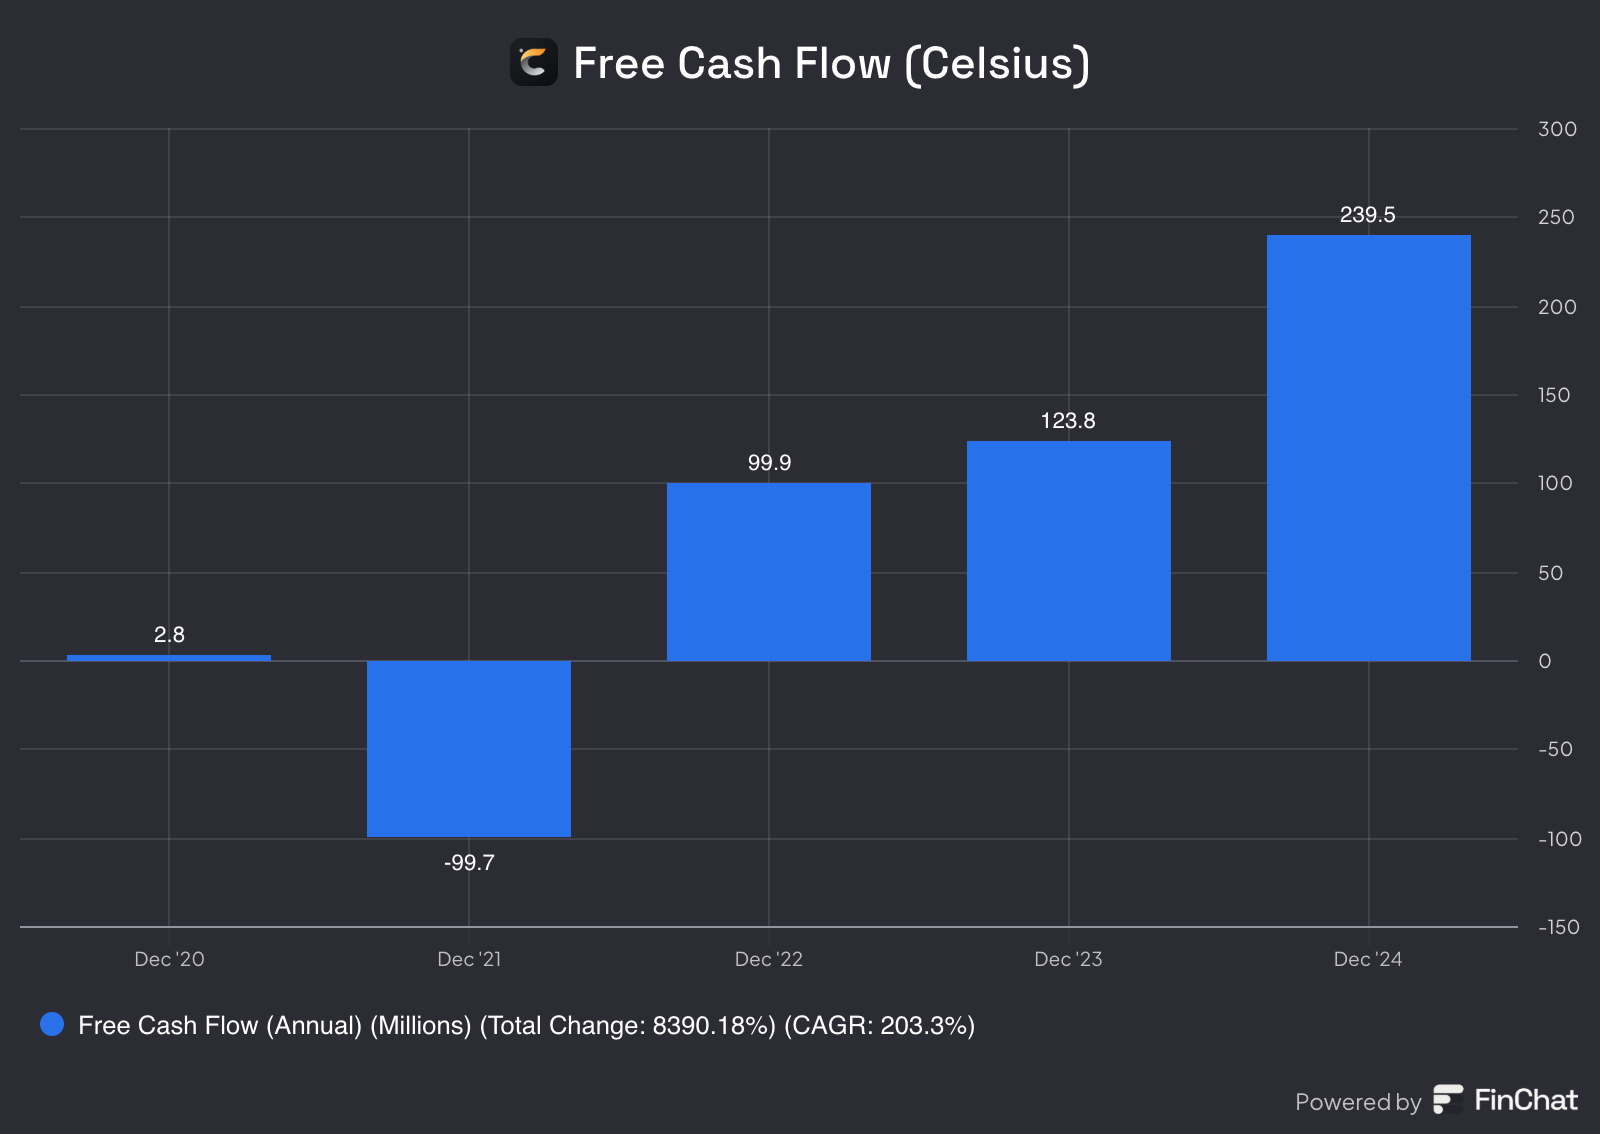
Free Cash Flow
Celsius has demonstrated strong Free Cash Flow in recent years, reflecting the company's ability to generate cash from its operations after accounting for capital expenditures. This robust cash flow is a positive sign of financial health, providing Celsius with the flexibility to reinvest in growth initiatives, pay down debt, or return value to shareholders.
If you enjoy using Finchat like I do, feel free to check it out through my link:
https://finchat.io/pricing/referralCode=eU7MvaPHfoU2sG5QDaSoUYVvpEb2
(Ps: I don’t get any money out of this, I just get to Unlock Pro for free for 1 month for every user I refer to FinChat)
KPI’s
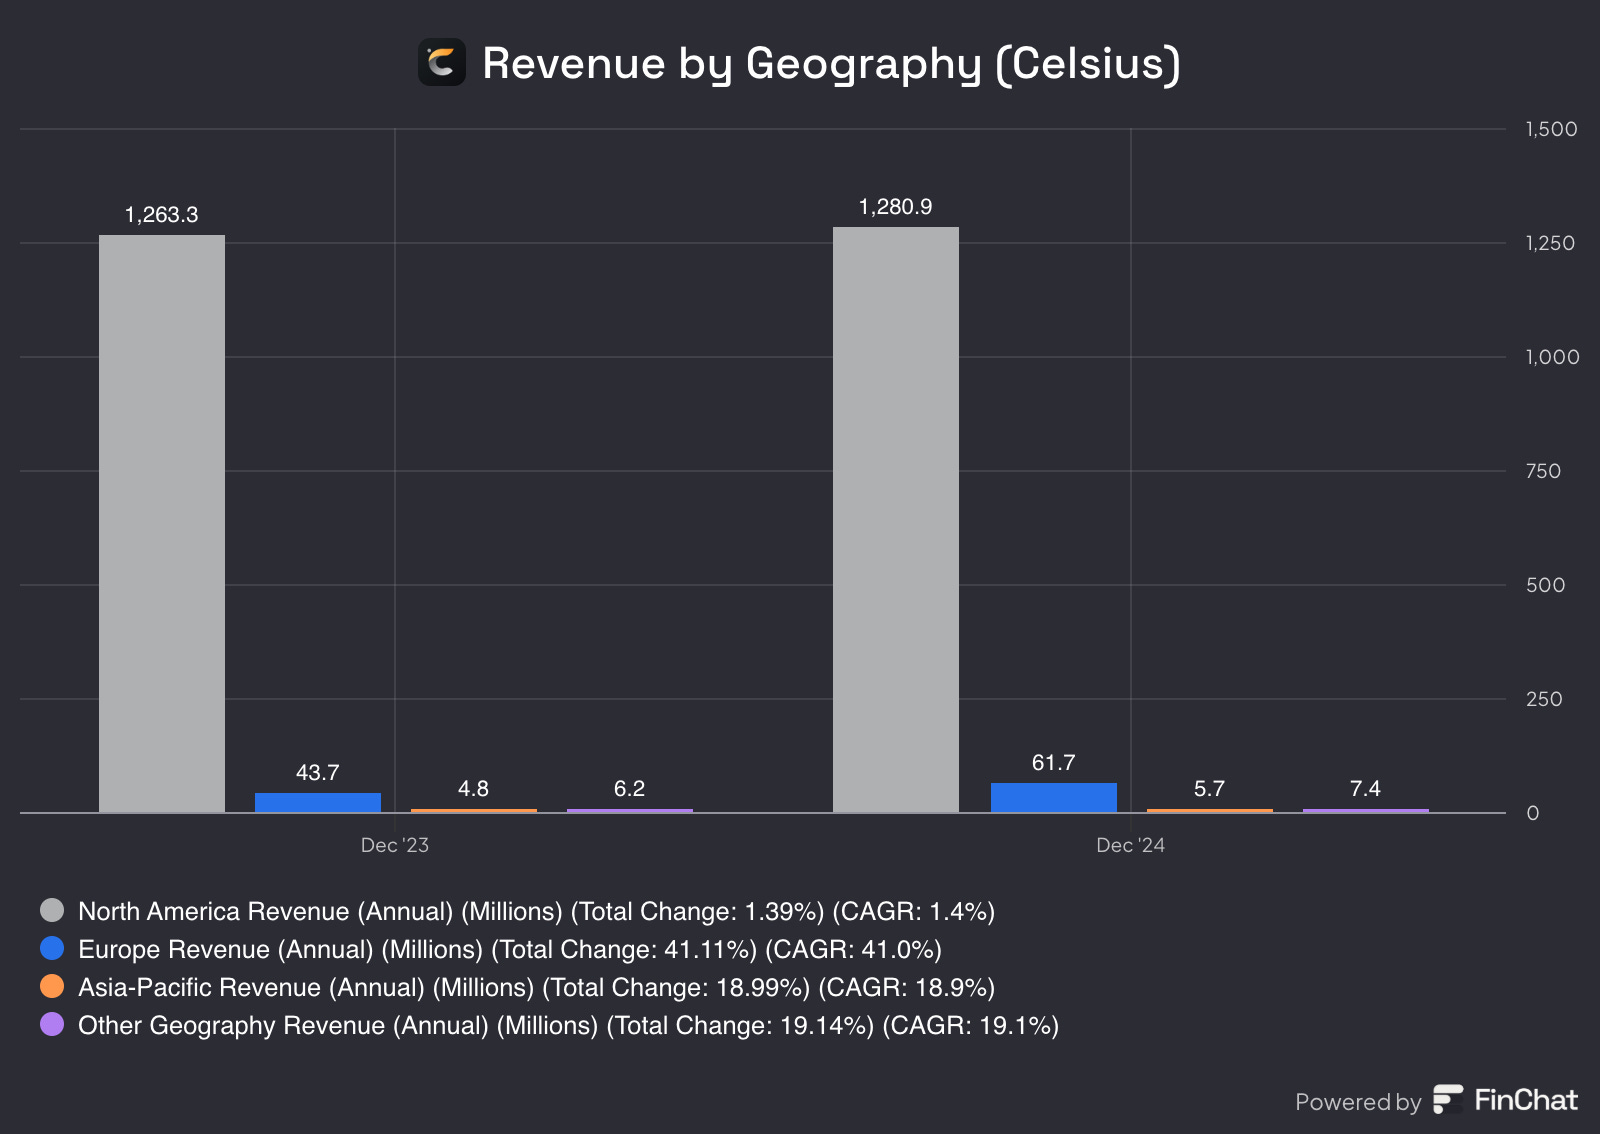
First and foremost, one of the most important KPI’s for me when evaluating a business is understanding where the revenue is coming from. Currently, most of Celsius' revenue still originates from the U.S., but Europe is showing strong growth as well.
Just a week ago, they announced an exciting expansion in Europe, adding Belgium and Luxembourg to their global growth strategy.
We can expect that Celsius is gonna be willing to expand even further in the future.
Another important KPI, is the following one:
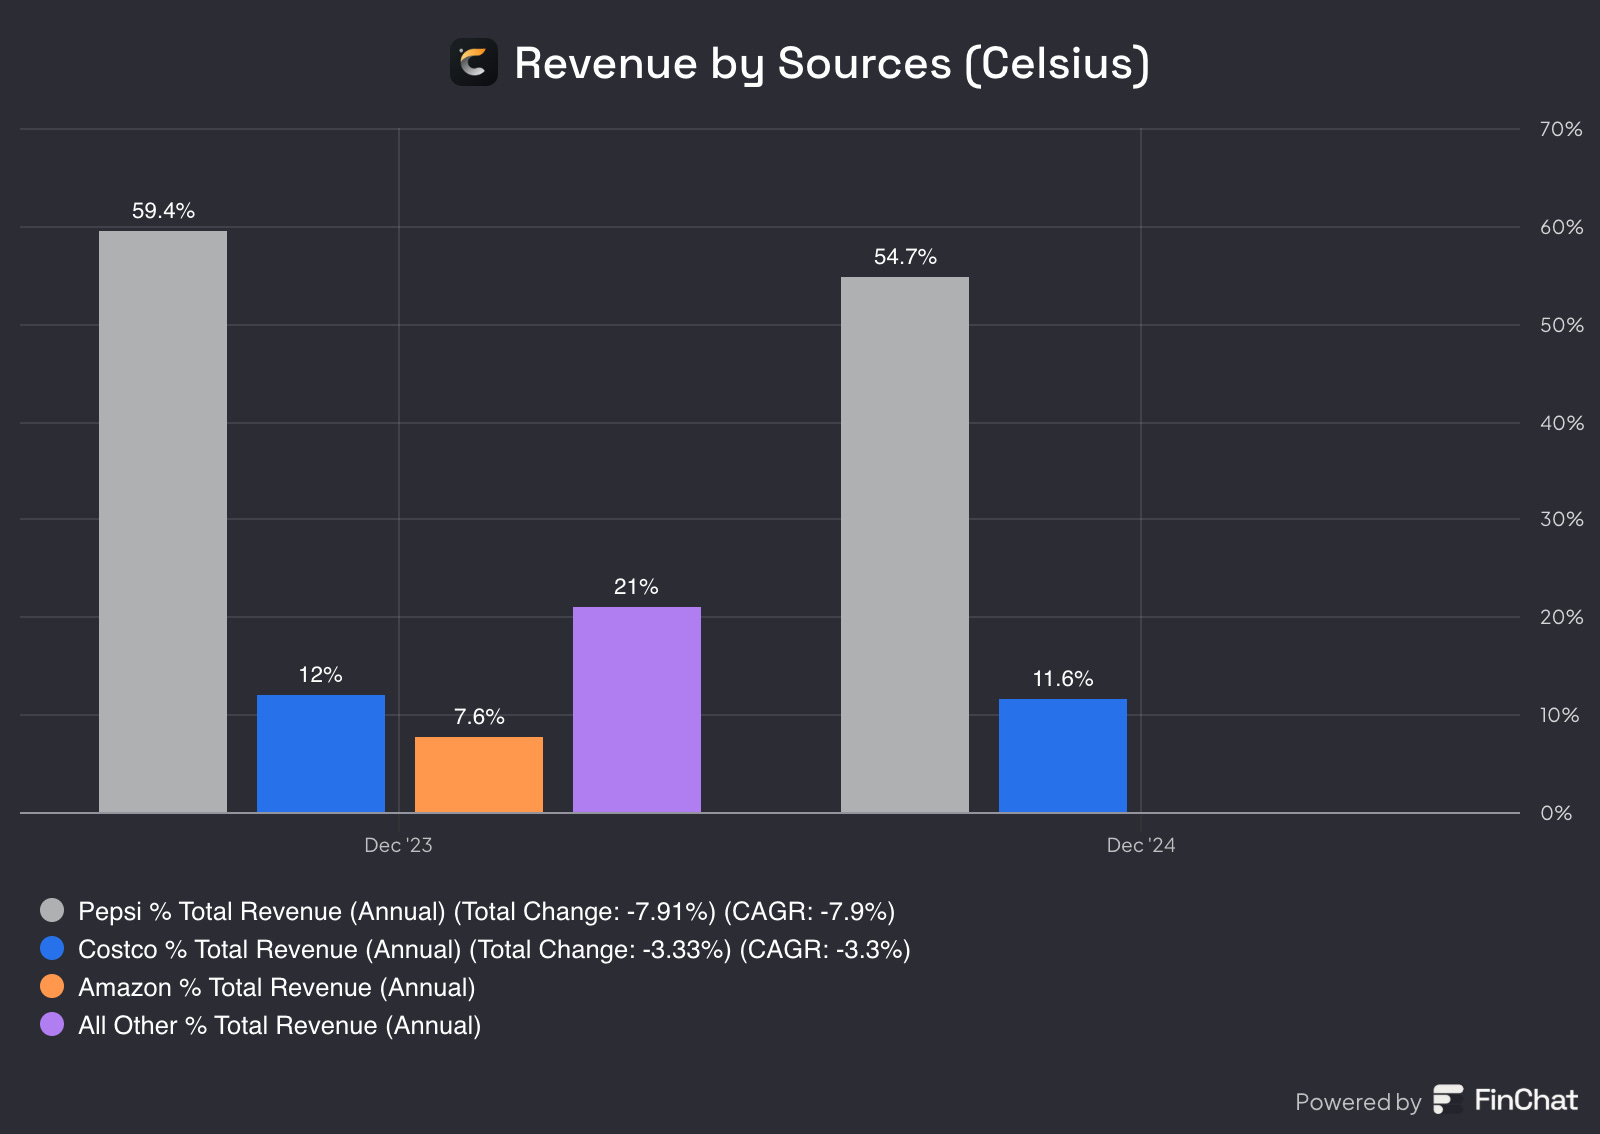
This metric shows where the revenue is generated from. It appears that most of Celsius' revenue comes from Pepsi, followed by Costco, and then Amazon.
Note: There isn't enough data available for 2024, so I’ve focused on the 2023 data to get a clearer picture of where the revenue is coming from.
If you like what you are reading thus far, make sure to SUBSCRIBE so you don’t miss any posts!
Skin in the game
When it comes to investing, "skin in the game" is a crucial factor. It shows that management truly believes in the company’s future.
In the case of Celsius Holdings (CELH), insider ownership plays a key role in building investor confidence.
It seems that management holds 14% of the shares, which is a positive sign since we like to see at least 10%. This level of ownership aligns leadership’s interests with those of shareholders, reinforcing their commitment to long-term growth.
This alignment ensures that decisions are made with the company’s best interests in mind. When management has real skin in the game, it signals strong conviction and accountability, factors that can drive sustained value creation.
Gross Profit and Net Income Margin
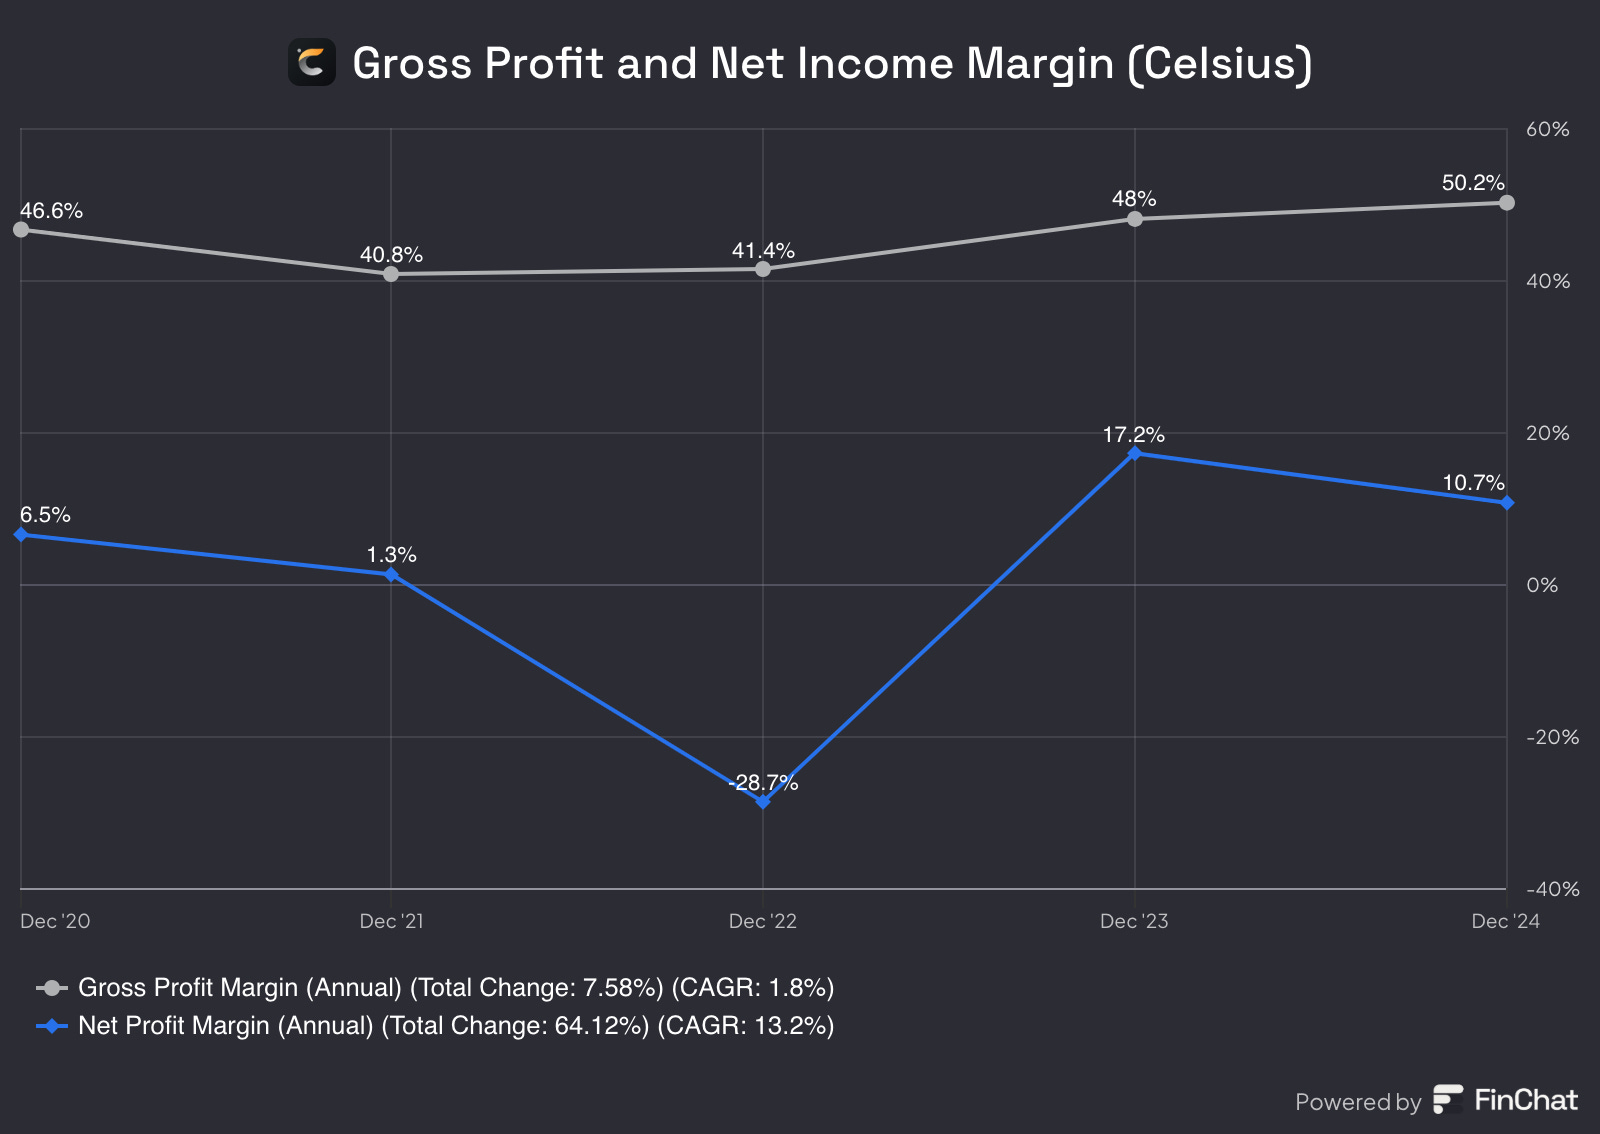
Celsius Holdings' gross profit margin and net income margin are key indicators of the company's profitability and operational efficiency.
The Gross Profit Margin reflects how much revenue remains after accounting for the cost of goods sold (COGS). Over the past few years, Celsius has seen significant expansion in its gross margin, driven by economies of scale, improved supply chain efficiencies, and a shift toward direct distribution. As the company continues to scale, its ability to maintain or expand its gross margin will be critical in assessing its long-term profitability.
The Net Income Margin, which measures the percentage of revenue that translates into actual profit after all expenses, has been more volatile. While Celsius has experienced rapid revenue growth, high marketing expenses, distribution costs, and investments in expansion have pressured its bottom line. However, as operating efficiencies improve and the company benefits from stronger brand recognition, there is potential for margin expansion.
A strong gross margin provides Celsius with the flexibility to reinvest in growth, while an improving net income margin would signal the company’s ability to translate revenue into sustainable profitability.
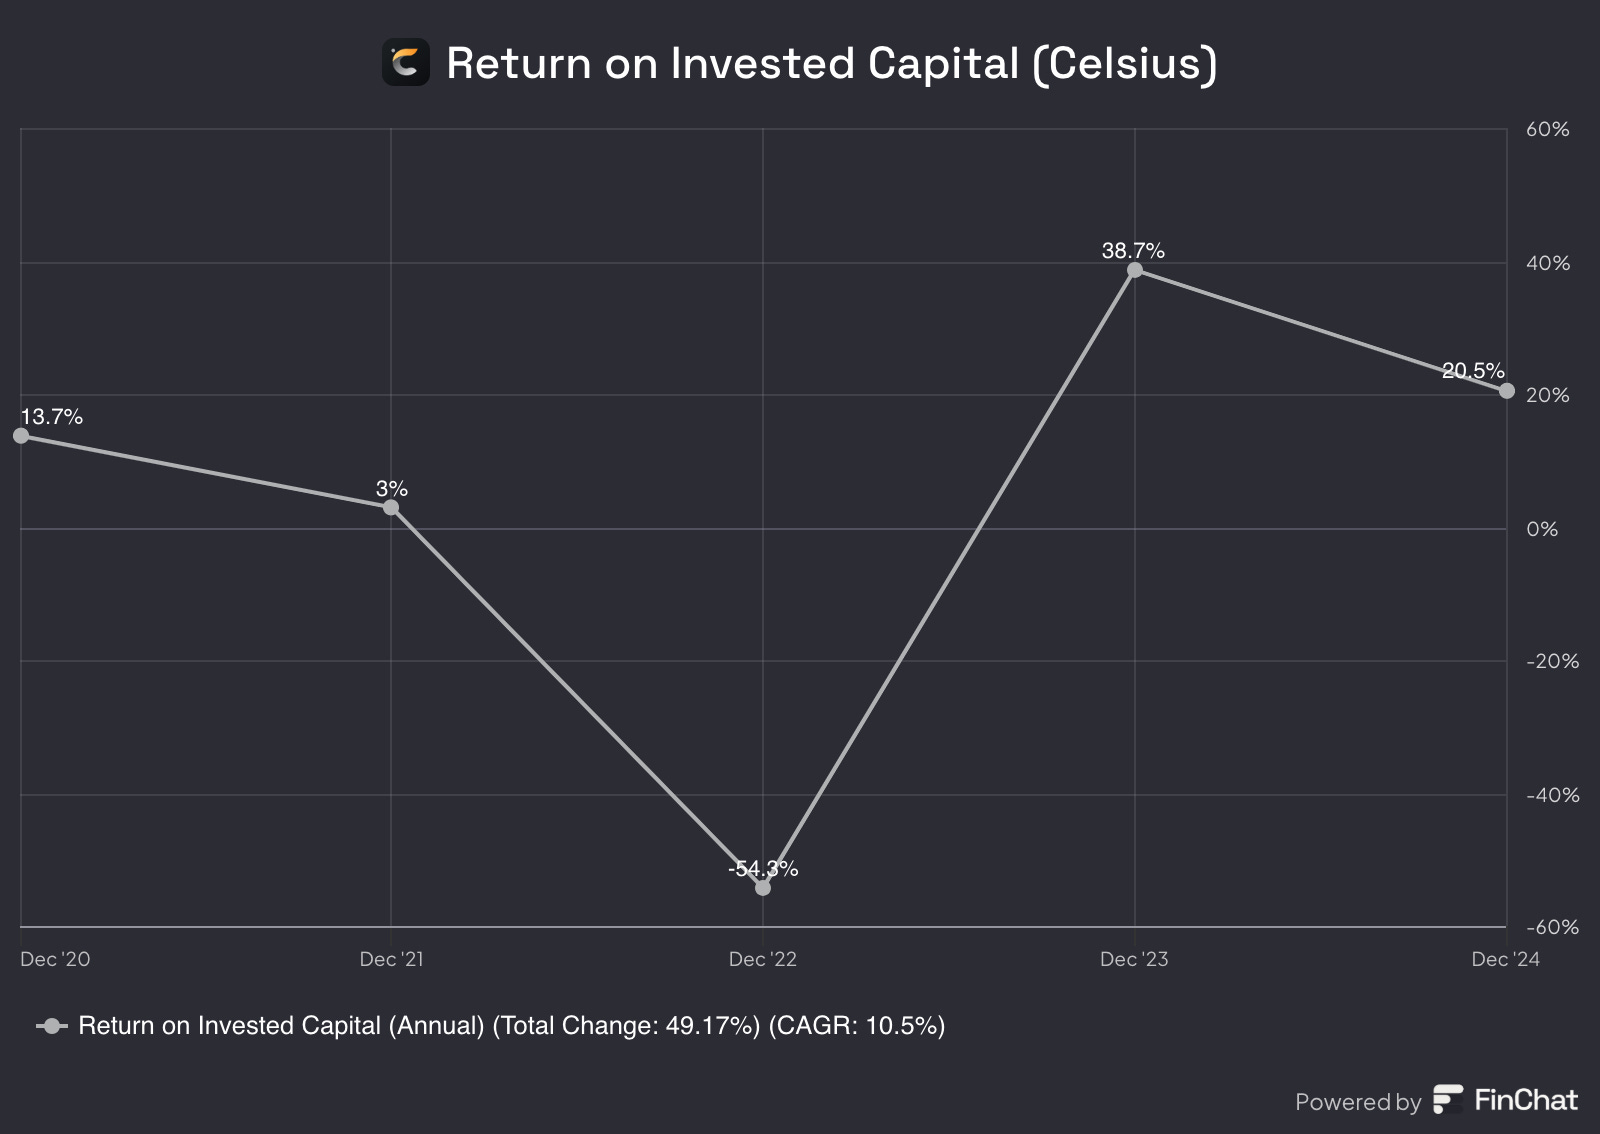
Return on Invested Capital (ROIC)
Over the past few years, Celsius' Return on Invested Capital (ROIC) has increased significantly, indicating that the company is making better investment decisions than ever before.
A 20% ROIC is impressive for a business like Celsius, as it suggests strong capital efficiency and profitability.
It's important to note that the Weighted Average Cost of Capital (WACC) is around 9%. Since ROIC exceeds WACC, this means the company is generating a positive return on the capital invested, creating real value for shareholders.
To refer back to buybacks, I would rather own a business that can show me that they are able to get great returns on their money.
Goodwill
When analyzing Goodwill, I always like to get a clear overview of a company’s assets and liabilities. This helps determine whether goodwill meaningfully enhances the company's asset base or if it’s simply inflating the balance sheet. Currently, that doesn’t seem to be the case.
Another key point to highlight is the following:
On February 20, 2025, Celsius Holdings announced a definitive agreement to acquire Alani Nutrition LLC ("Alani Nu") for $1.8 billion, including $150 million in tax assets, resulting in a net purchase price of $1.65 billion. The acquisition is expected to be finalized in the second quarter of 2025. (Currently the acquisition has been finalized.)
If you want some more information on Alani Nu, you should definitely check out my previous post on Celsius:

Goodwill will be calculated as the excess of the purchase price over the net identifiable assets acquired. Therefore, the exact amount of goodwill to be recorded on Celsius' balance sheet will only be determined after the valuation process is completed.

Don’t forget to SUBSCRIBE and share, if you enjoy the content! A like will also be appreciated!
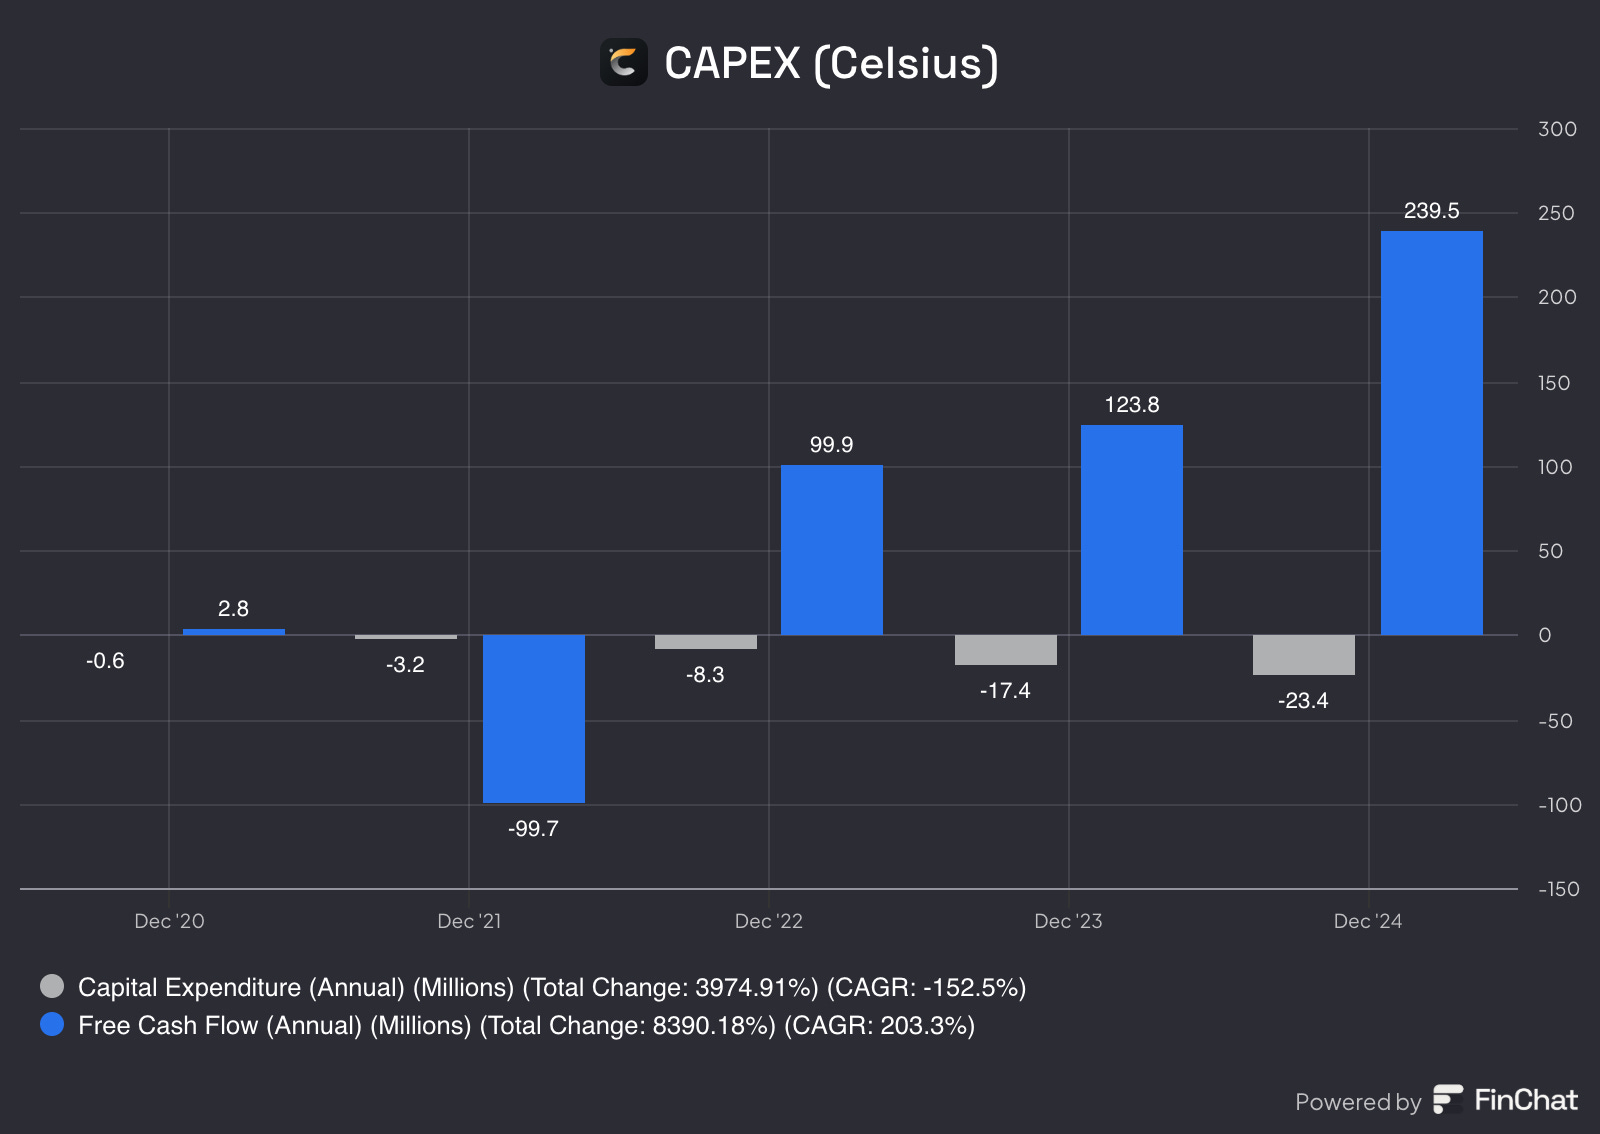
Capex (Maintenance/growth)
When evaluating a company's financial health, comparing Capital Expenditures (CAPEX) to Free Cash Flow provides valuable insights into its investment efficiency and liquidity.
Celsius Holdings has demonstrated a strong balance between CAPEX and FCF in recent years:
‘23: CAPEX totaled $17.4 million, while FCF reached $123.8 million, resulting in an FCF margin of 9.4%.
‘24: CAPEX increased to $23.4 million, with FCF significantly rising to $239.5 million, leading to an FCF margin of 17.7%.
This trend indicates that Celsius is effectively managing its capital investments, allowing for substantial free cash flow to support ongoing operations, debt reduction, and potential shareholder returns.
Stock Based Compensation
Stock-based compensation (SBC) is a non-cash expense which means that it affects financial statements but does not directly impact Free Cash Flow. However, it does have indirect effects on a company’s financial health and valuation.
How SBC Affects Free Cash Flow
SBC is Added Back to Operating Cash Flow (OCF):
Since SBC is a non-cash expense, it is deducted from Net Income on the Income Statement but added back when calculating Operating Cash Flow under the indirect method of cash flow reporting.
This can make FCF appear higher, even though it does not actually generate cash.
Potential Dilution Impact:
While SBC increases FCF in the short term (since it's a non-cash expense), it leads to more outstanding shares over time, which can dilute earnings per share (EPS) and affect stock value.
Investors should be cautious when high SBC artificially boosts FCF while increasing share dilution.
Adjusted Free Cash Flow (Adj. FCF)
To account for SBC’s impact, some investors use an Adjusted FCF metric:
Adjusted FCF = FCF − SBC
This adjustment gives a more conservative view of true cash generation by treating SBC as an actual cost to shareholders.
Let’s now take a look at Celsius’ stock based compensation:
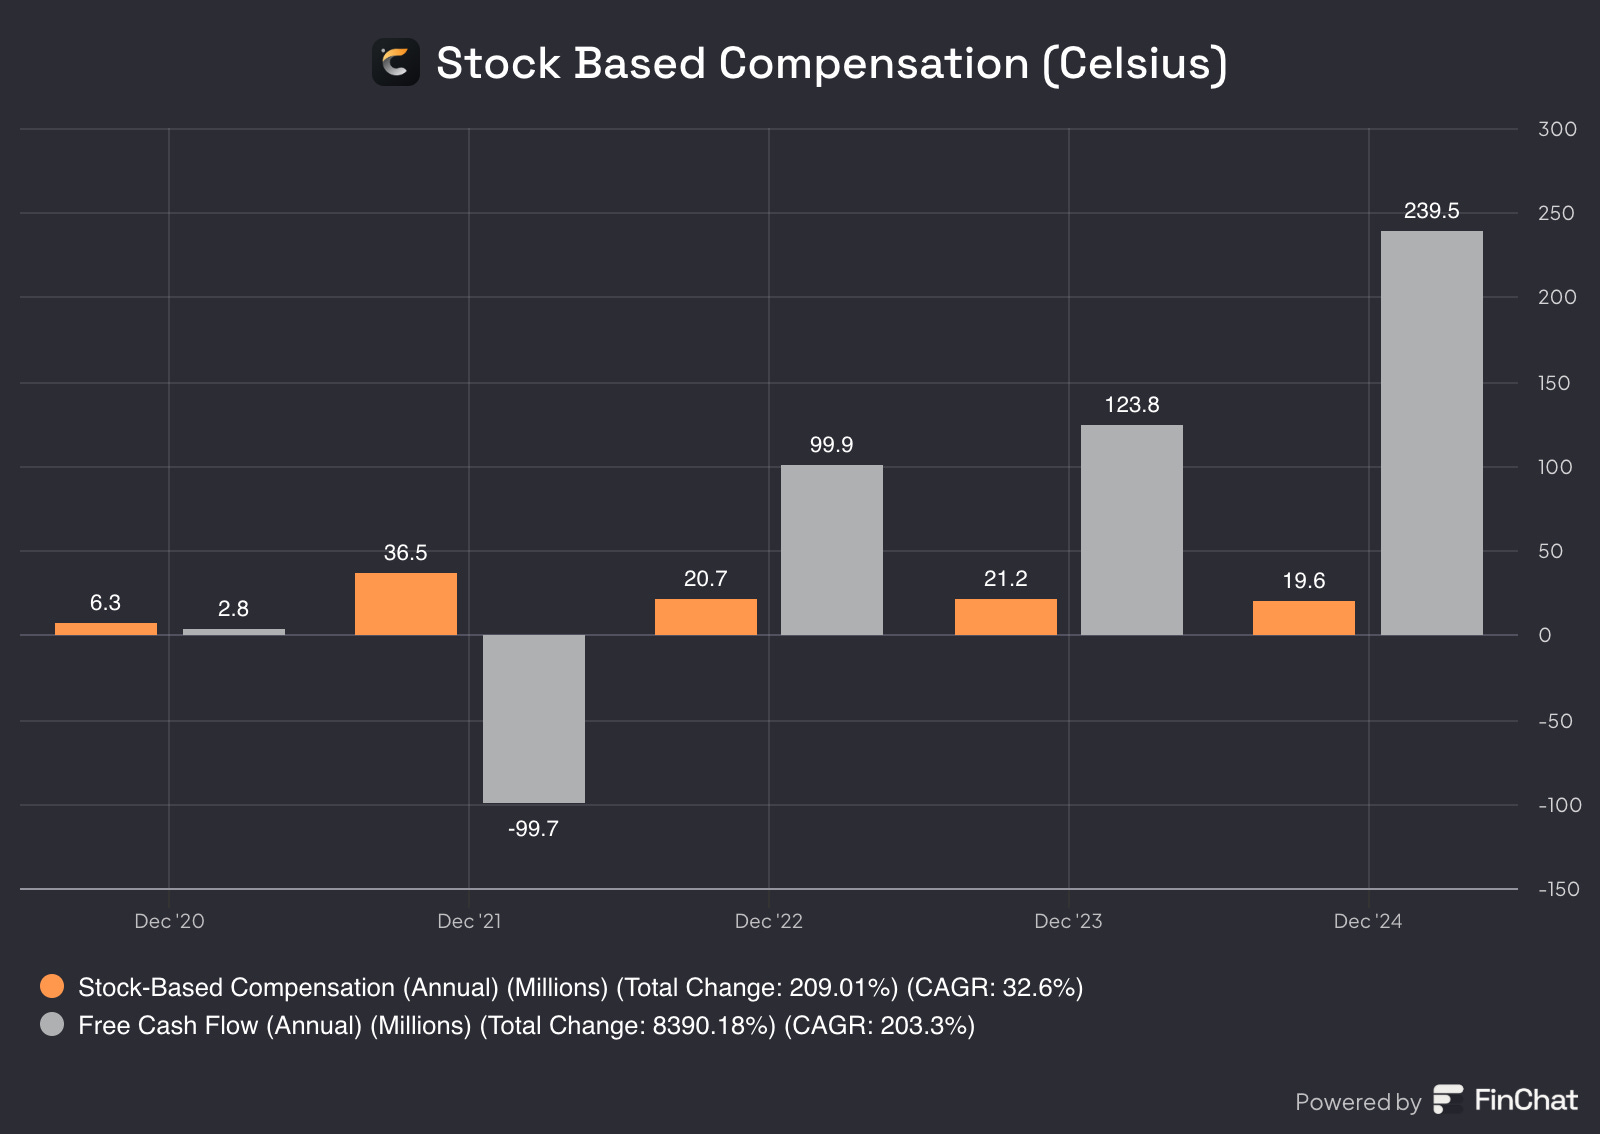
Celsius has been issuing stock-based compensation, which boosts its reported operating cash flow and, consequently, Free Cash Flow.
However, SBC is declining, which is a positive sign. Additionally, the gap between FCF and SBC is increasing, indicating that SBC’s impact on FCF is gradually diminishing.
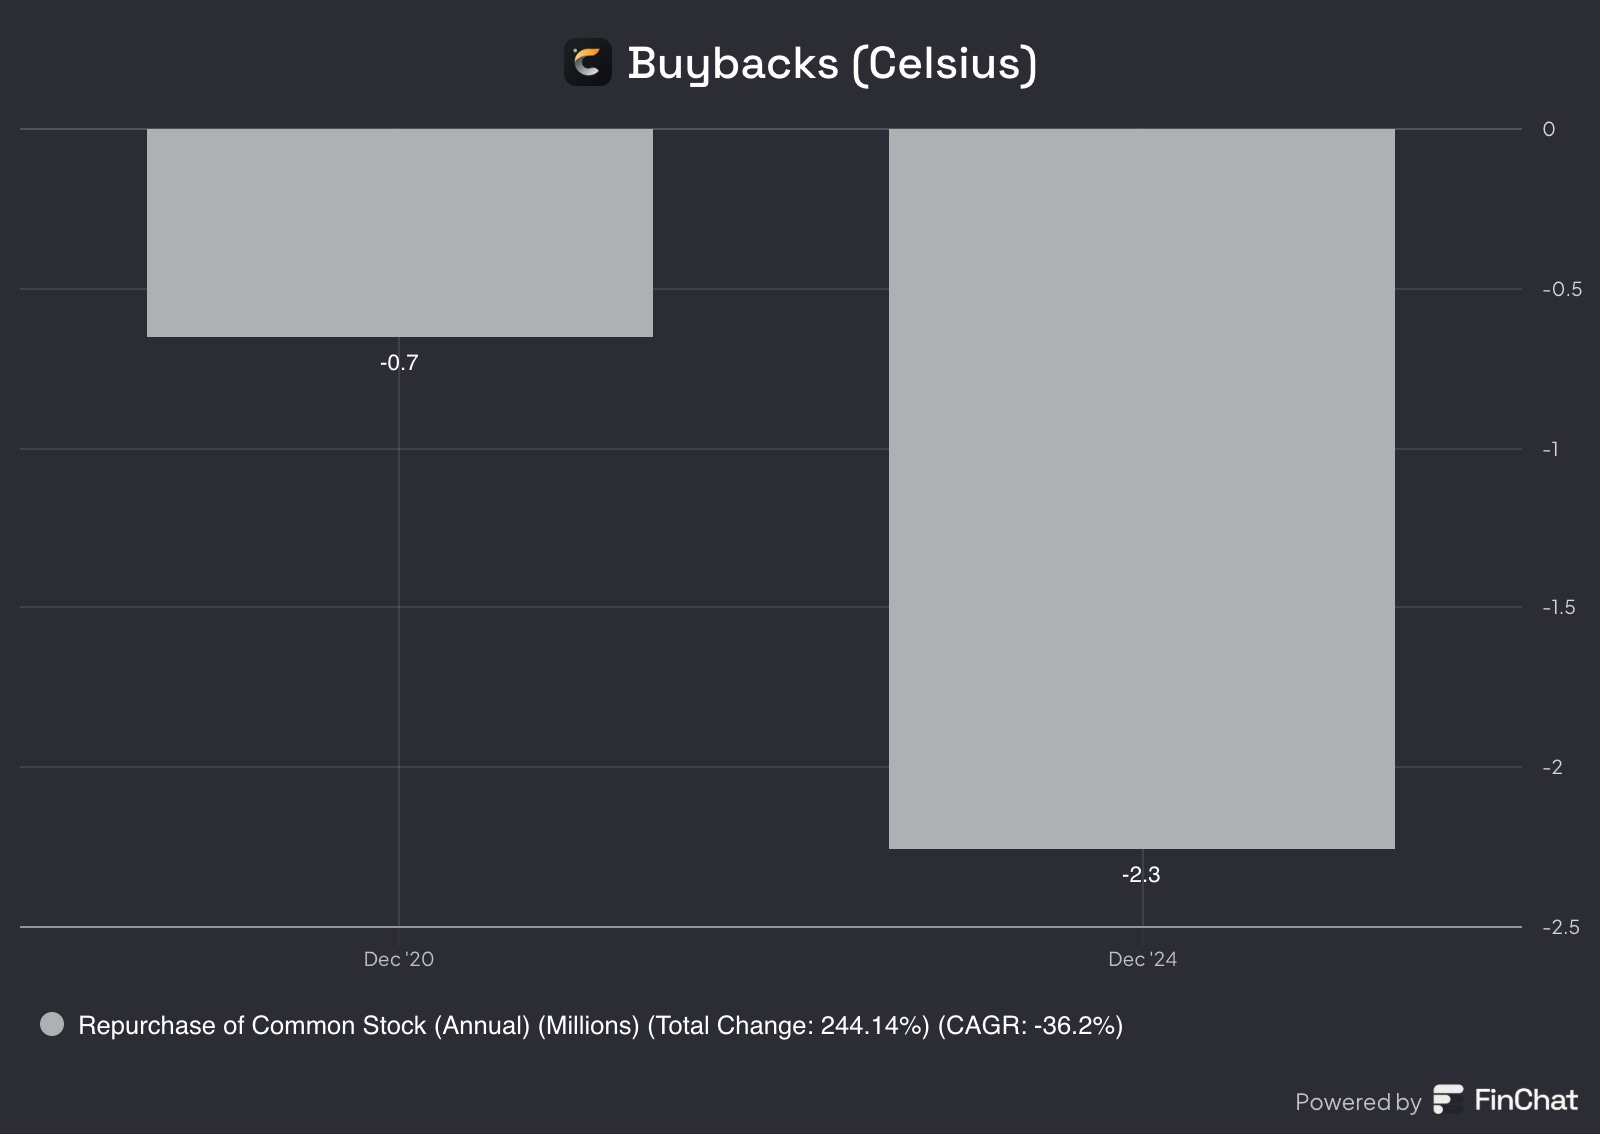
Buybacks
It appears that Celsius only repurchased shares in 2020 and 2024. Last year, they bought back around 2.3 million shares out of a total of 235 million shares.
It doesn't seem like they currently have a formal share buyback program, or at least I couldn’t find any specific information on it.
As an investor, share buybacks are generally seen as a positive sign because they can increase the value of the shares you currently own. They often indicate management’s confidence in the company’s future and can help drive long-term shareholder value.
If I’m being honest, I’m not the biggest fan of buybacks. I believe companies could put that money to better use by investing in initiatives that genuinely strengthen the business. Rather than spending cash on buybacks, they could focus on areas that drive long-term growth and create real value. But hey, I’m just a simple investor, what do I know?
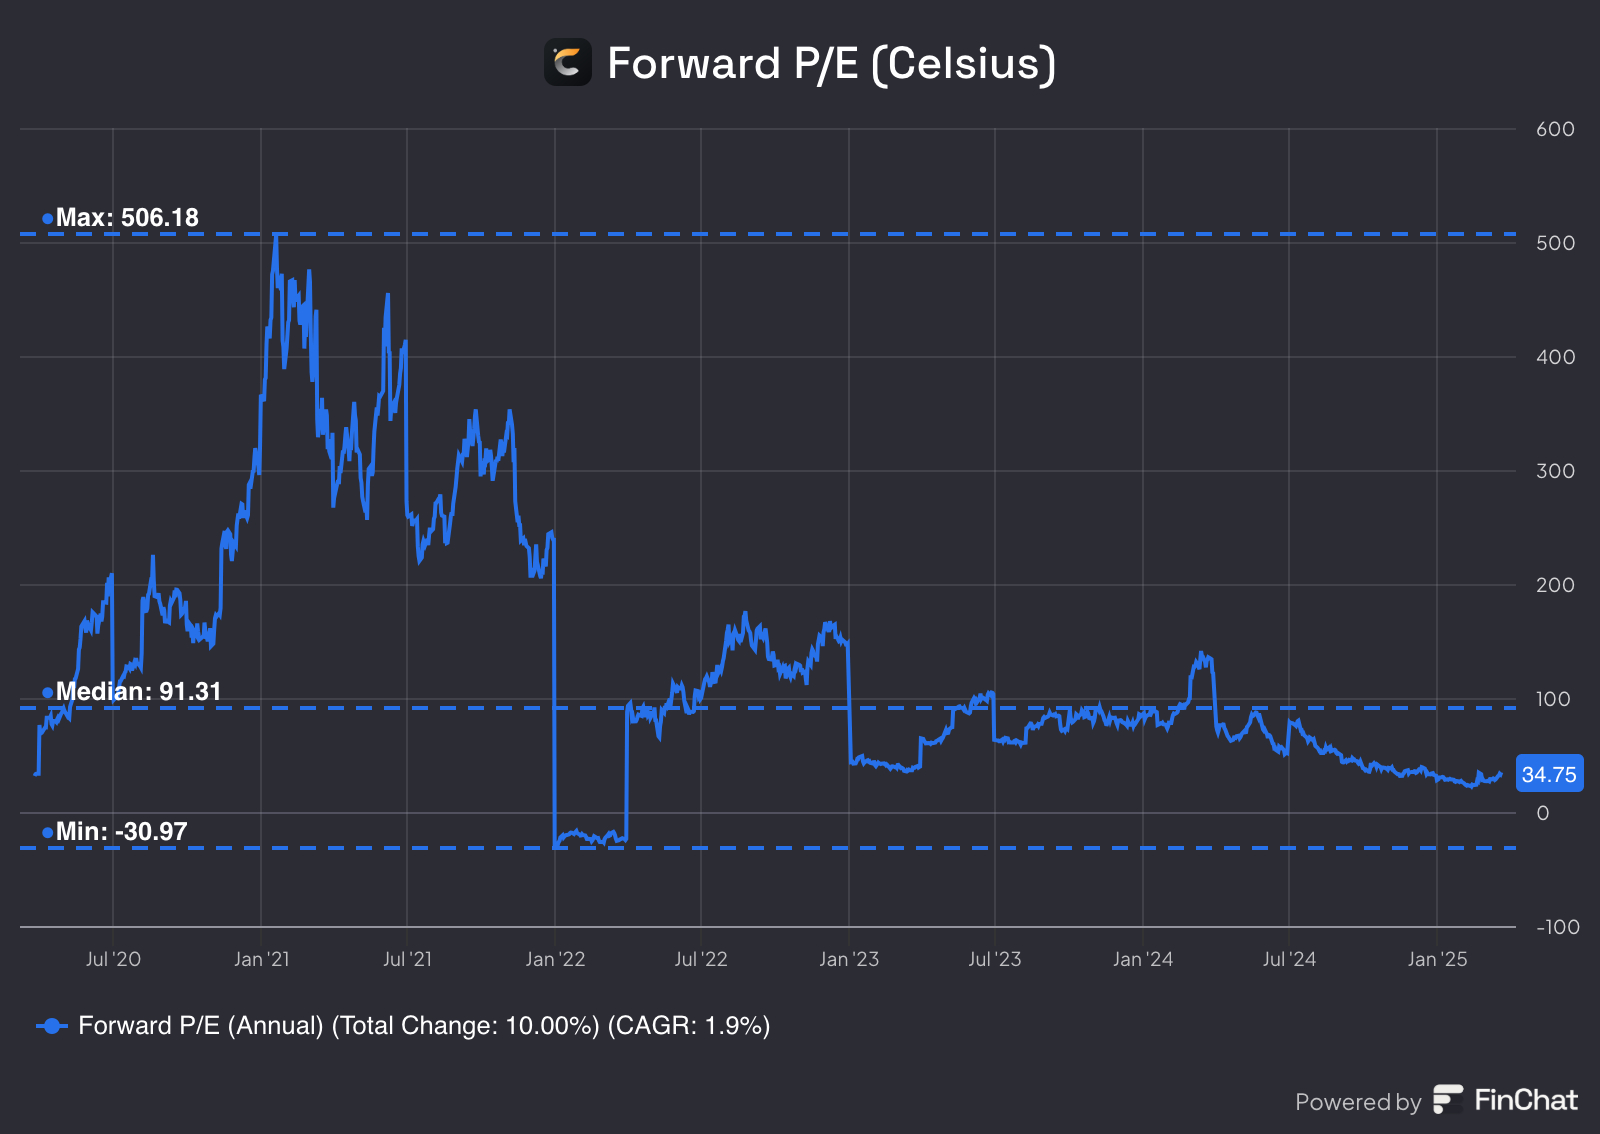
Forward P/E
In 2021, Celsius Holdings’ forward P/E ratio soared above 500, signaling exceptionally high growth expectations and strong investor confidence. This extreme valuation suggested that the market was pricing in substantial future earnings expansion.
However, in 2022, the ratio experienced a sharp decline, likely driven by downward revisions in earnings forecasts, macroeconomic headwinds such as rising interest rates, and a broader shift in market sentiment. The drop may also reflect a combination of stronger earnings performance and slower stock price appreciation, which naturally compresses the P/E ratio.
Since 2023, the forward P/E has settled at a more moderate level, currently standing at 34.75, well below the historical median of 91.31. This shift indicates a recalibration of investor expectations, possibly due to a more measured growth outlook or an improvement in the company’s underlying profitability.
When I look at the Forward P/E, I always compare it to the stock’s historical median to get a sense of whether it’s undervalued or overvalued. But it’s also key to remember that this ratio is based on earnings, so if earnings are going down, the multiple can be pretty misleading. A low P/E might look attractive, but it doesn’t mean much if the business is struggling underneath.
Celsius forward P/E is trading below its historical median, suggesting the stock may currently be undervalued based on this metric.
Forward P/FCF
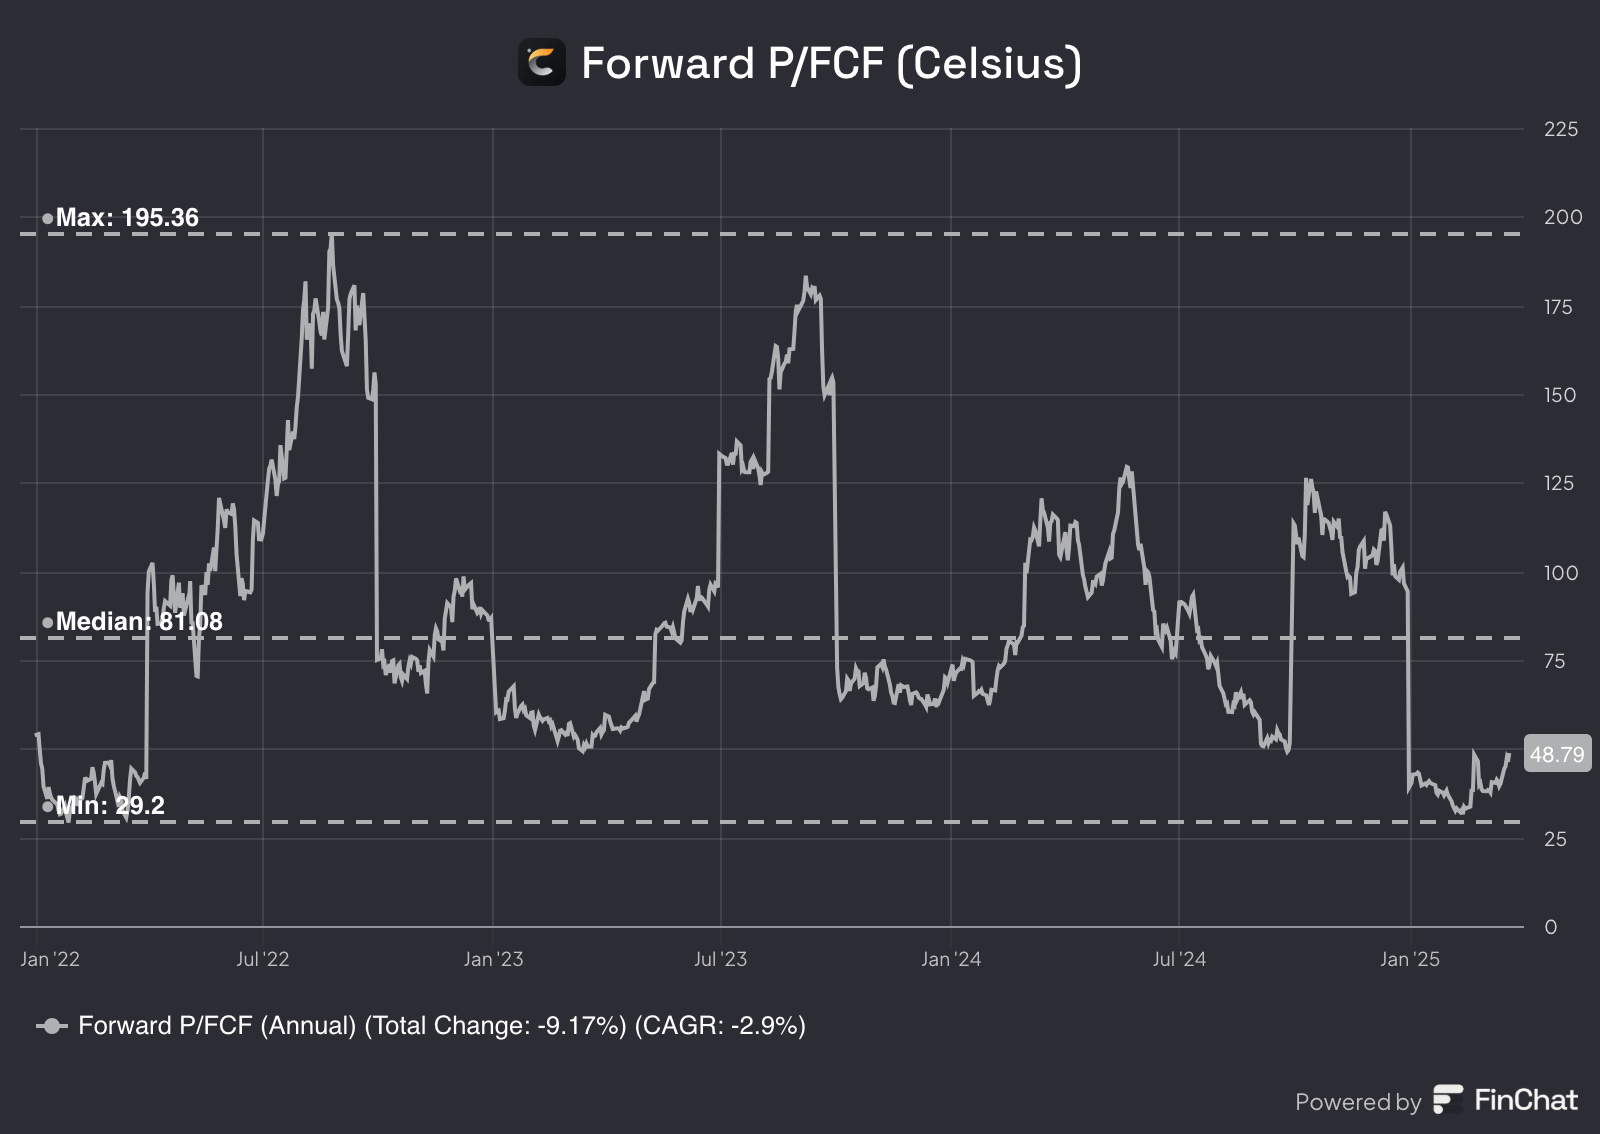
The forward price-to-free cash flow (P/FCF) ratio of Celsius Holdings has exhibited significant volatility over the past few years. In early 2022, the ratio was relatively low but experienced a rapid surge, peaking at 195.36, indicating exceptionally high investor expectations for future cash flow growth.
However, this extreme valuation was unsustainable, leading to multiple sharp declines and recoveries throughout 2023 and 2024. These fluctuations likely reflect changing market sentiment, shifts in free cash flow generation, and broader macroeconomic factors such as interest rate adjustments and liquidity conditions.
Currently, the forward P/FCF ratio stands at 48.79, which is considerably below its median value of 81.08. This suggests that while investor enthusiasm has moderated, the stock is still priced at a premium relative to its historical lows. The decline in the ratio over time, with a total change of -9.17% and a compound annual growth rate (CAGR) of -2.9%, indicates a recalibration of expectations regarding Celsius Holdings' cash flow potential.
Just as we saw with the P/E ratio, the company’s valuation has transitioned from extreme highs to a more measured level, possibly reflecting a maturing business model and more realistic growth projections.
When I look at the Forward P/FCF, I always compare it to the stock’s historical median to get a sense of whether it’s undervalued or overvalued. But it’s also key to remember that this ratio is based on free cash flows, so if free cash flows are going down, the multiple can be pretty misleading. A low P/FCF might look attractive, but it doesn’t mean much if the business is struggling underneath.
Celsius forward P/FCF is trading below its historical median, suggesting the stock may currently be undervalued based on this metric.
Forward EV/EBITDA
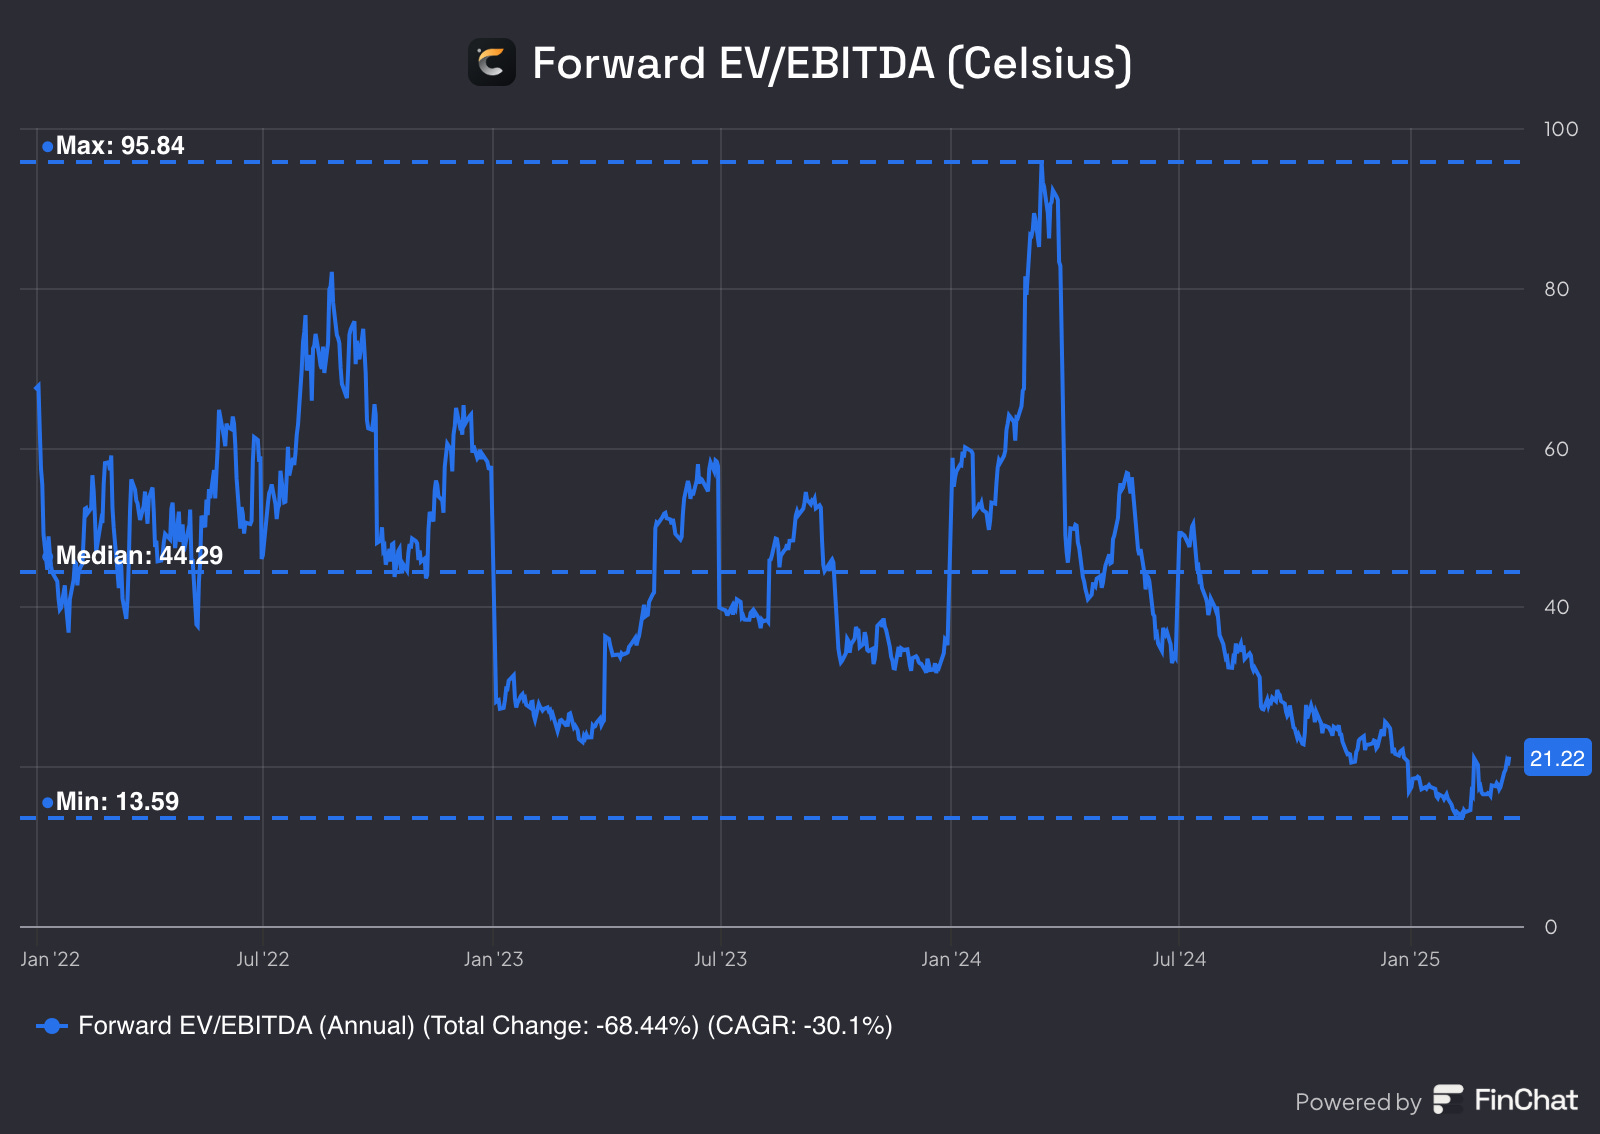
The forward EV/EBITDA ratio of Celsius Holdings has undergone a significant decline over the past few years, reflecting a shift in market valuation.
At its peak, the ratio reached 95.84, indicating high investor expectations for future earnings growth. However, this elevated valuation proved unsustainable, leading to multiple periods of contraction.
Since early 2023, the ratio has steadily declined, currently sitting at 21.22, which is well below its median value of 44.29. This suggests that investors have adjusted their expectations, potentially due to changes in earnings projections, macroeconomic conditions, or a reassessment of growth potential.
However, just like with the P/E and P/FCF, the quality and trajectory of the underlying earnings (in this case, EBITDA) matter a lot, if those are weakening, the lower multiple could reflect justified concerns rather than an opportunity.
Celsius forward EV/EBITDA is trading below its historical median, suggesting the stock may currently be undervalued based on this metric.
Earnings Growth Model
This model tells us the yearly expected return based on growth of the earnings and shareholder yield.
The formula looks like the following:
Expected return = EPS growth + dividend yield +/- multiple expansion (contraction)Here are the assumptions I use:
EPS Growth = 25% per year over the next 10 years
Dividend Yield = / (there is no dividend)
Forward PE to increase from 35x to 50x (median) over the next 10 years
Expected return = 25% + 0 - 0.1*((50-35)/35))= 20.7%So, this means that we should be happy with a return of 20.7% per year.
In case of a 20% EPS growth, we get the following:
Expected return = 20% + 0 - 0.1*((50-35)/35))= 15.7%With an estimated 20% EPS growth, we should expect a 15.7% return per year.
Reverse DCF
Finally, let’s do a reverse DCF on Celsius Holdings.
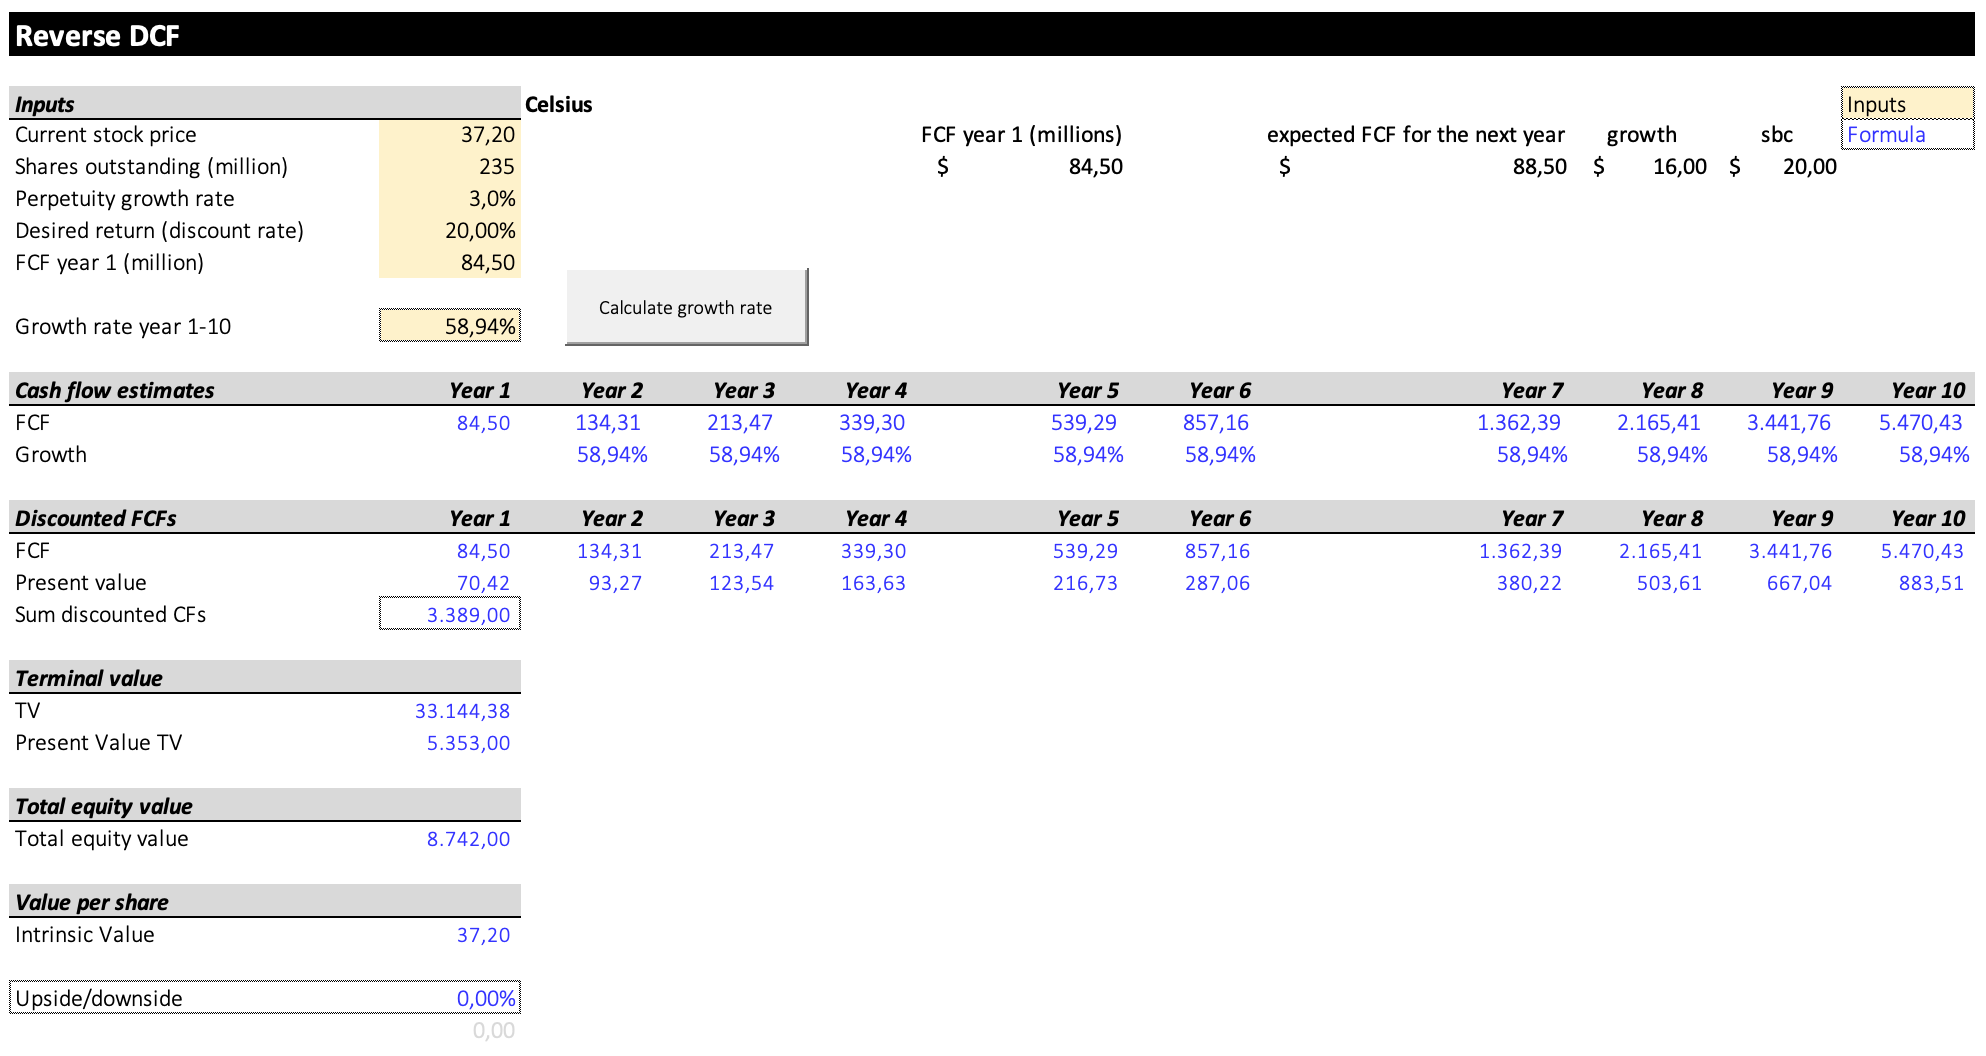
So, what does all of this mean?
For context, the discount rate in case of Celsius is 20% and not 10%, because I expect a higher annual return from them (cause it’s a growth stock).
Basically, to justify a 20% annual return, Celsius needs to grow FCF by 58.94%/yr.
Its 5-year historical FCF growth? 203%.
Of course, that's not a realistic CAGR to use for comparison. That’s why I’m focusing on the growth over the past two years, which was around 55%. That’s the figure I consider more relevant for comparison.
At today’s price, Celsius looks “slightly overvalued” based on the metric that I’m using here.
2. Technical Analysis
In this second section, I’ll cover a short Technical Analysis on Celsius Holdings.
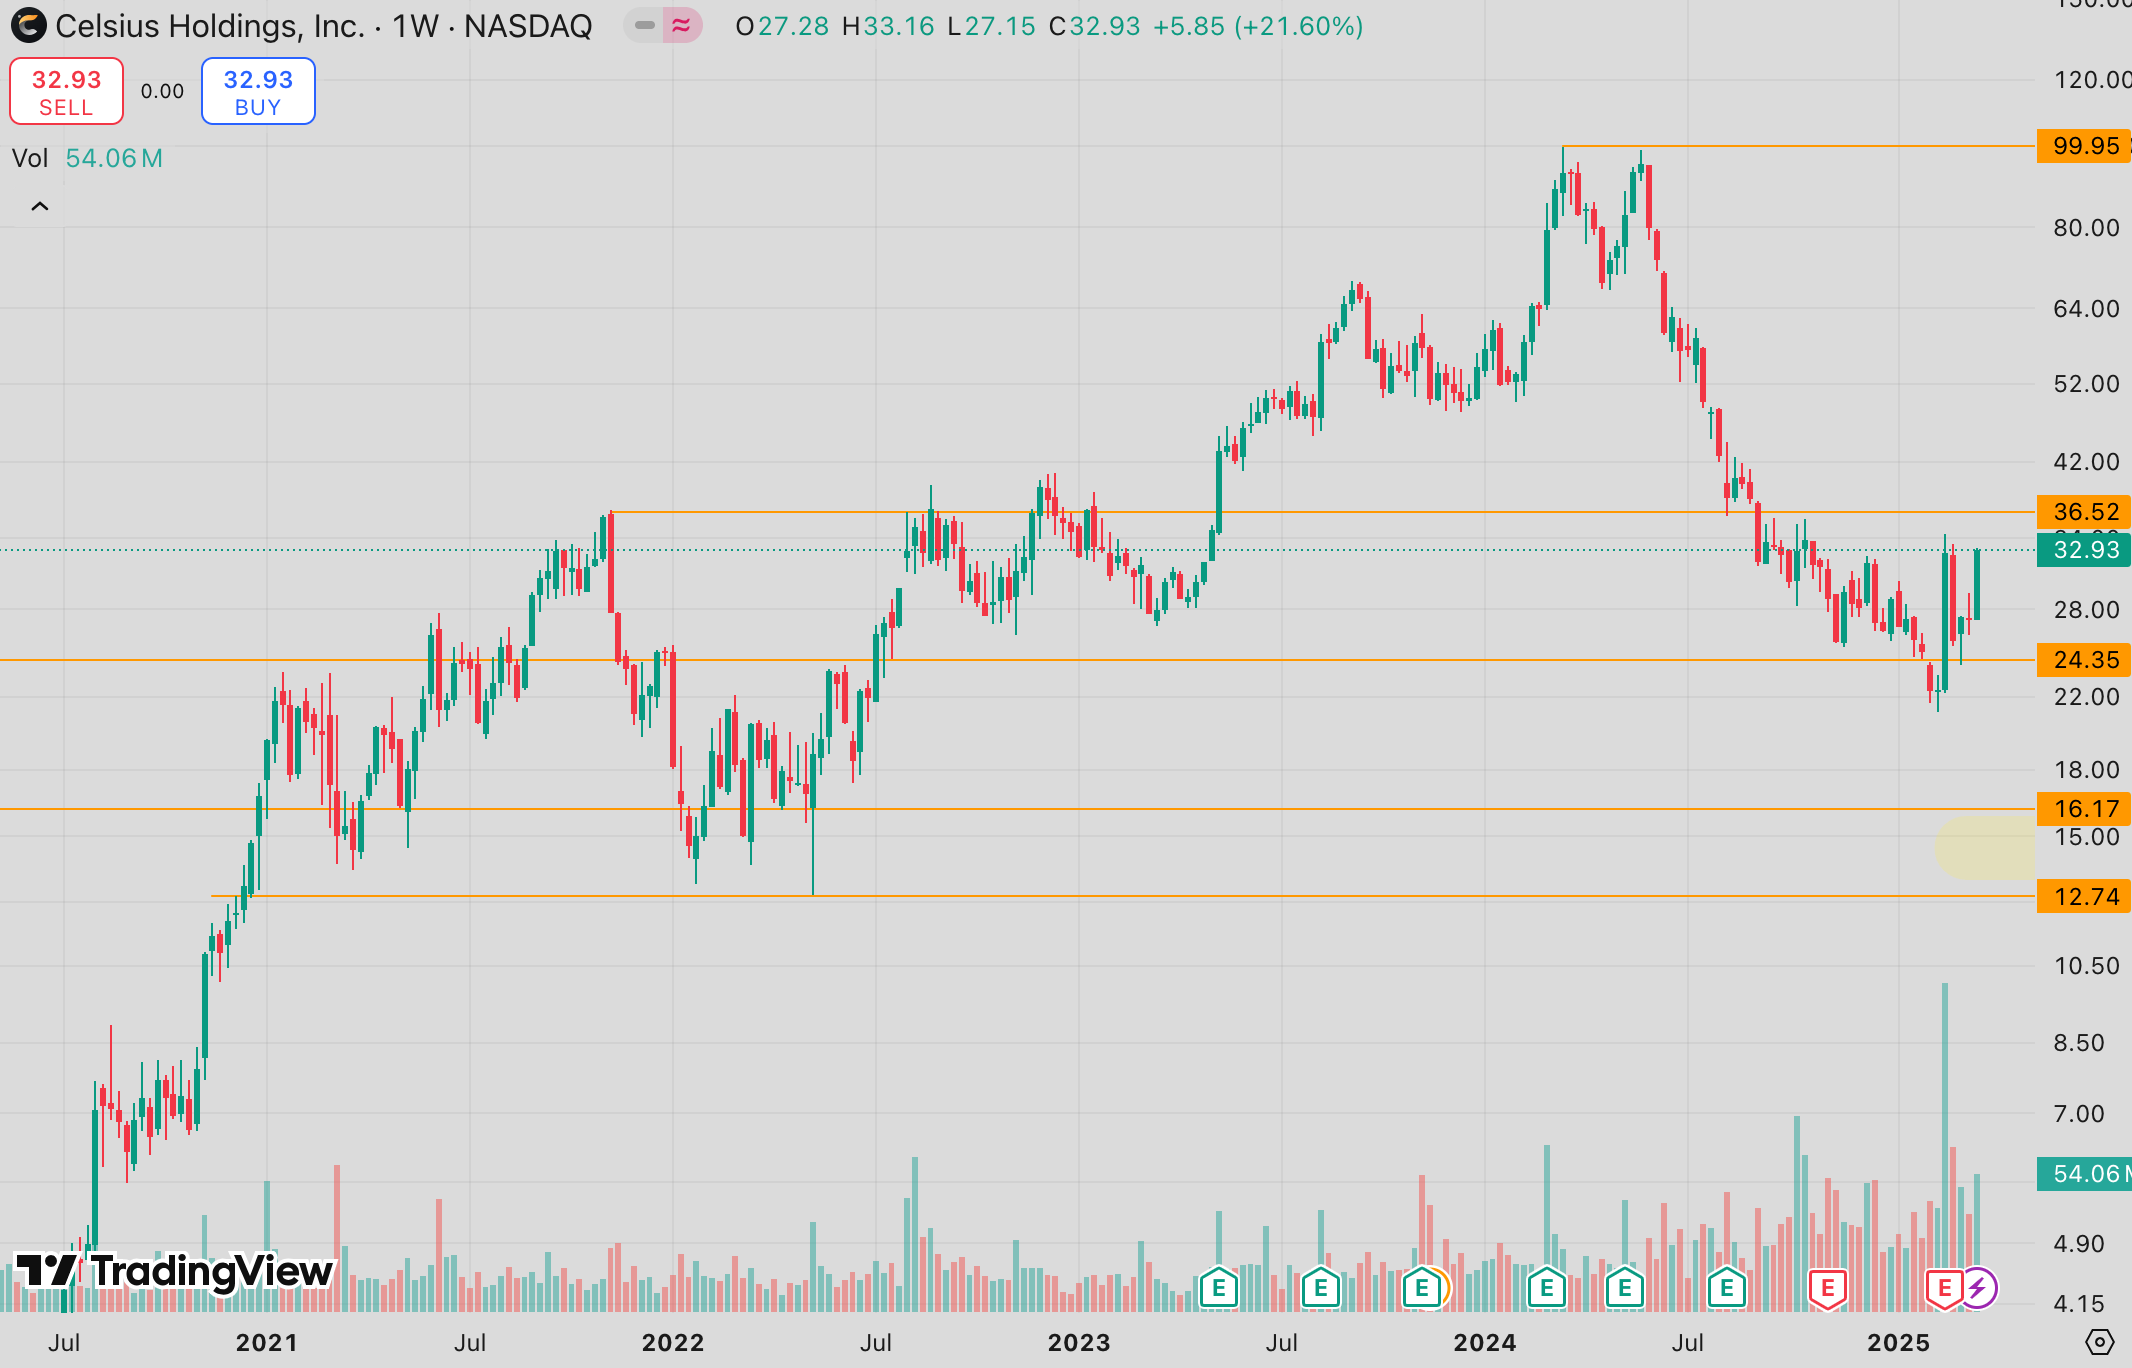
As you can see on this chart, Celsius’ price is currently trading above the support line at $24. I’ve set out a BUY zone between $16 and $13 but at $24 you could’ve already gotten a nice starter position to begin with (50% allocation) and then further down the line you can add the other half when the price is more attractive. This is pure technical and can be validated with fundamentals.
Thank you for reading this article! If you enjoyed reading it, make sure to SUBSCRIBE so you don’t miss out any posts! And share, leave a comment!
If you enjoyed reading this article, you might enjoy these other ones to:


Disclaimer:
The content of this analysis is for informational purposes only and should not be considered financial or investment advice. The opinions expressed are my own and based on publicly available information at the time of writing. Before making any investment decisions, please conduct your own research or consult with a professional financial advisor to assess your individual situation. Investing in the stock market involves risk, and past performance is not indicative of future results.
Disclosure: I do own this business myself. And I’m of the opinion that you should always do your own due diligence, before making any investment decision.