


Arista Networks: A Forgotten AI and Cloud Conglomerate
A Fundamental and Technical Analysis.

Overview
Today, I’ll cover the following of Arista Networks :
Fundamental Analysis
Technical Analysis
This is also the framework that I’ll be using when doing a Deep Dive into a Company that might be ready to BUY.
If you’re interested in seeing more of these Deep Dives where I discuss a companies Fundamentals and Technicals, make sure to SUBSCRIBE so you don’t miss any FREE insights!
1. Fundamental Analysis
In the next section I’ll discuss the following things:
General Overview (Total Revenues, Net Income, EBITDA, Free Cash Flow)
KPI’s
Skin in the game
Gross Profit and Net Income Margin
ROIC
Goodwill
Capex
Stock Based Compensation
Buybacks
Forward P/E
Forward P/FCF
Forward EV/EBITDA
Earnings Growth Model
Reverse DCF
General Overview
In this first part, I’ll discuss the overall fundamentals of the business: Total Revenues, Net Income, EBITDA, Free Cash Flow.
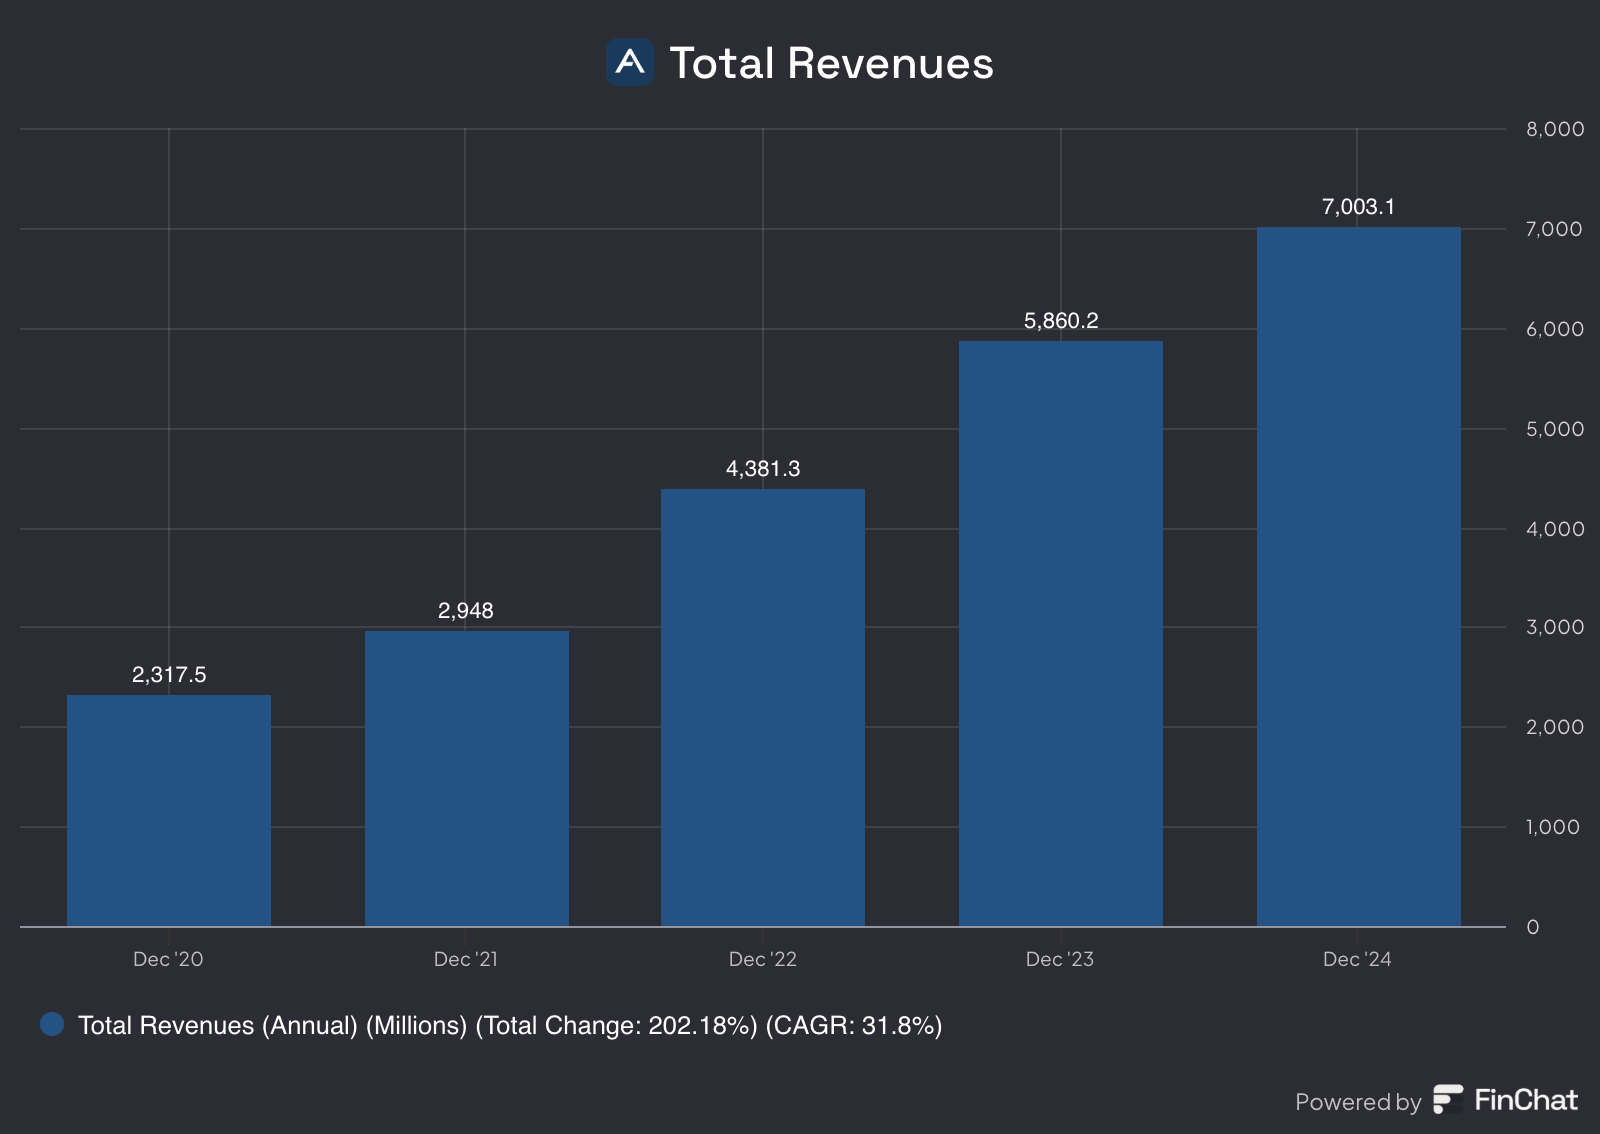
Total Revenues
Total revenues appear to be growing rapidly, with a CAGR of around 32% over the past five years. This is a strong indicator of Arista’s strength. The revenue growth in the past year doesn’t to slow down, the company still maintains significant expansion.
Net Income
Over the last five years, Arista has seen significant growth in its net income. This positive trend highlights their ability to scale efficiently and manage costs, positioning them for sustained financial success as they continue expanding their market presence.

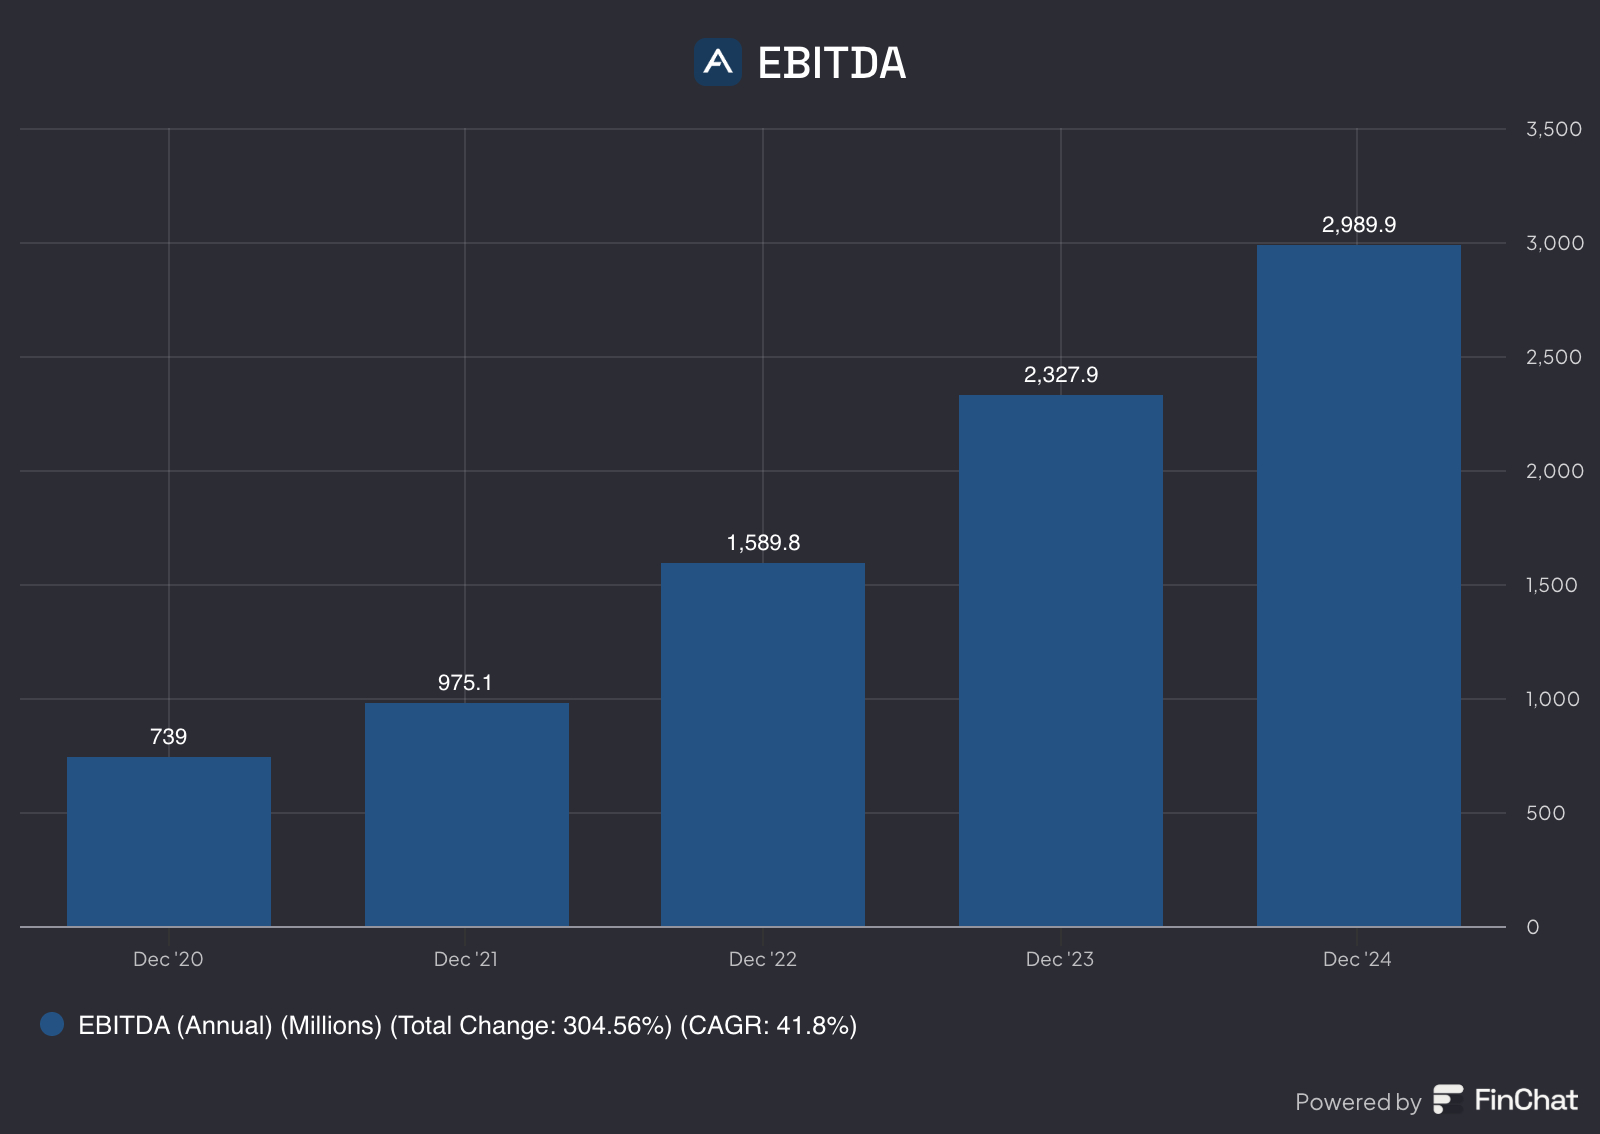
EBITDA
The same can be said about Arista’s EBITDA. As you can see here:
Free Cash Flow
As you can see, Arista has demonstrated strong Free Cash Flow in recent years, reflecting the company's ability to generate cash from its operations after accounting for capital expenditures. This robust cash flow is a positive sign of financial health, providing Arista with the flexibility to reinvest in growth initiatives, pay down debt, or return value to shareholders.

If you enjoy using Finchat like I do, feel free to check it out through my link:
https://finchat.io/pricing/referralCode=eU7MvaPHfoU2sG5QDaSoUYVvpEb2
(Ps: I don’t get any money out of this, I just get to Unlock Pro for free for 1 month for every user I refer to FinChat)
KPI’s
First and foremost, one of the most important KPI’s for me when evaluating a business is understanding where the revenue is coming from. Currently, most of Arista's revenue still originates from the U.S., but EMEA and APAC regions are showing decent growth as well.
We can expect that Arista is gonna be willing to expand in this regions even further in the future.

Another important KPI, is the following one:
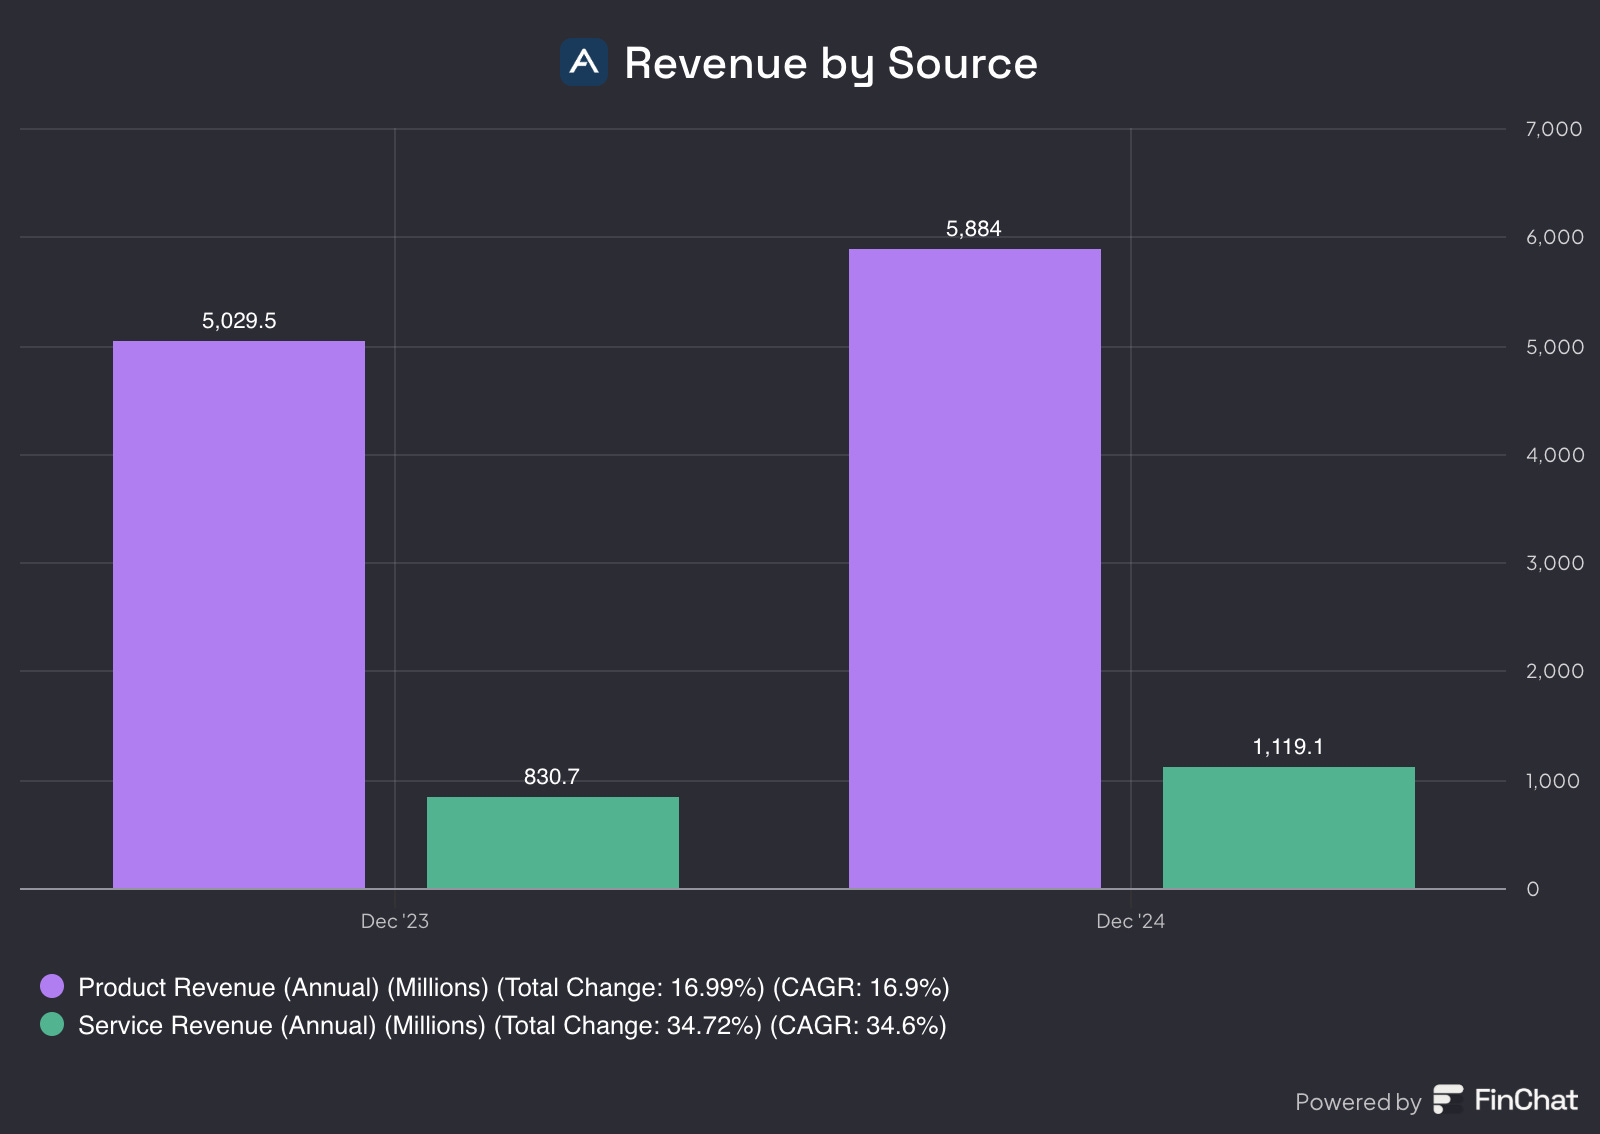
This metric shows where the revenue is generated from. It appears that most of Arista's revenue comes from their products, followed by the services they sell. The services business is a smaller portion of their revenues, but it seems to grow at a rapid pace.
If you like what you are reading thus far, make sure to SUBSCRIBE so you don’t miss any posts!
Skin in the game
When it comes to investing, "skin in the game" is a crucial factor. It shows that management truly believes in the company’s future.
In the case of Arista Networks, insider ownership plays a key role in building investor confidence.
It seems that management holds 18% of the shares, which is a positive sign since we like to see at least 10%. This level of ownership aligns leadership’s interests with those of shareholders, reinforcing their commitment to long-term growth.
This alignment ensures that decisions are made with the company’s best interests in mind. When management has real skin in the game, it signals strong conviction and accountability, factors that can drive sustained value creation.
Gross Profit and Net Income Margin
Starting with the gross profit margin, Arista has maintained a consistently high level over the years, fluctuating slightly between 63.9% and 64.1%. This stability showcases strong cost management and pricing power within its business model, enabling it to retain a large portion of its revenue after covering the cost of goods sold. Despite minor dips in 2022 and 2023, Arista managed to bring its gross margin back up to 64.1% in 2024, reflecting its effective cost control and high operational efficiency.
On the other hand, the net income margin has shown significant growth during the same period. Starting from 27.4% in 2020, it increased each year, reaching an impressive 40.7% by the end of 2024. This upward trend is particularly notable, as it indicates not just efficient cost control but also strong profitability after all expenses are accounted for, including taxes and operating costs. The 48.74% total change over four years with a 10.4% CAGR underlines Arista's capability to improve its bottom line consistently.
The key takeaway from this chart is Arista's ability to expand its net margins while maintaining strong gross margins, signaling both cost efficiency and pricing strength. This margin expansion is a clear indicator of robust business execution and disciplined financial management, making Arista a compelling story in the tech space.

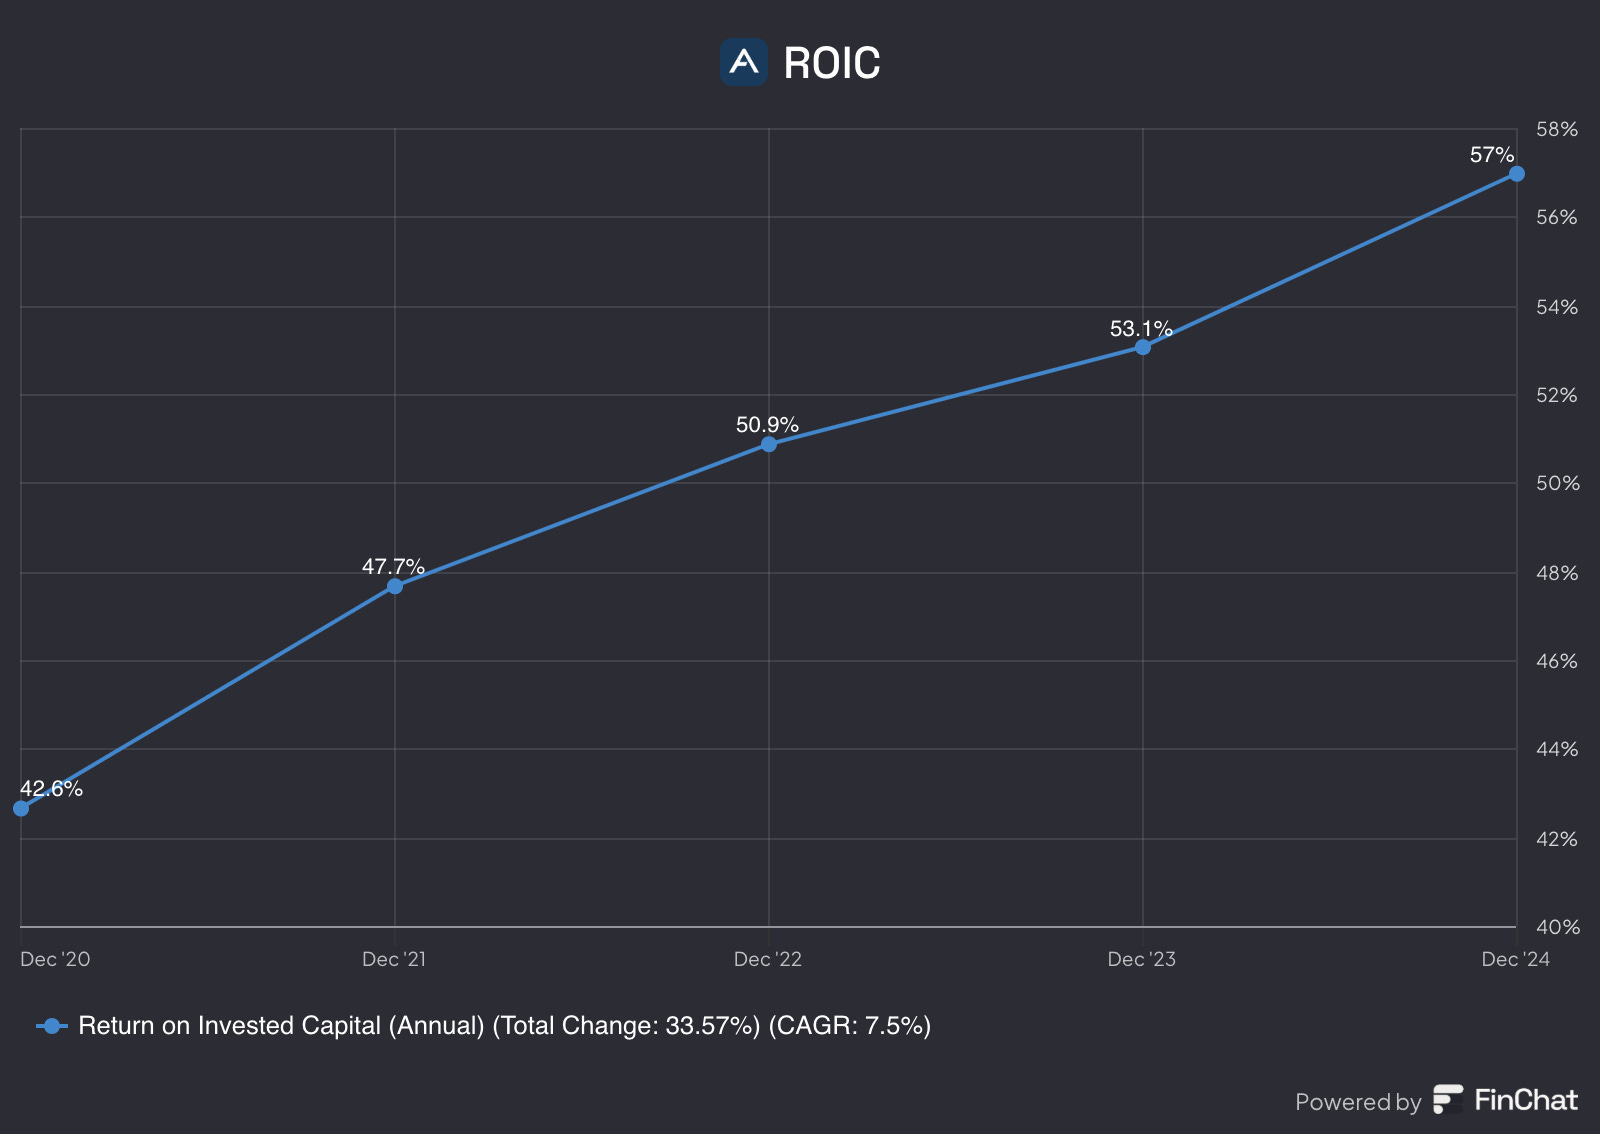
Return on Invested Capital (ROIC)
The last couple of years their Return on Invested Capital has increased drastically, it seems that they are making good capital allocations.
A 57% ROIC is exactly really great for a business like Arista.
Goodwill
When analyzing Goodwill, I always like to get a clear overview of a company’s assets and liabilities. This helps determine whether goodwill meaningfully enhances the company's asset base or if it’s simply inflating the balance sheet. This doesn’t seem to be the case at all.
Arista has been significantly growing its assets, leading to a substantial increase in shareholder equity, a strong indicator of the company's financial health. Unlike some companies that inflate assets through goodwill, Arista's growth appears to be driven by tangible business expansion, making this development even more impressive.

Capex
When evaluating a company's financial health, comparing Capital Expenditures (CAPEX) to Free Cash Flow (FCF) provides valuable insights into its investment efficiency and liquidity.
Arista Networks has demonstrated a strong balance between CAPEX and FCF in recent years:
2023: CAPEX totaled $34.4 million, while FCF reached $1,999.6 million.
2024: CAPEX decreased to $32 million, with FCF significantly rising to $3,676.2 million.
This trend indicates that Arista is effectively managing its capital investments, allowing for substantial free cash flow to support ongoing operations, debt reduction, and potential shareholder returns.

If you like what you are reading, make sure to SUBSCRIBE so you don’t miss any posts!
Stock Based Compensation
Stock-Based Compensation (SBC) is a non-cash expense which means that it affects financial statements but does not directly impact Free Cash Flow (FCF). However, it does have indirect effects on a company’s financial health and valuation.
How SBC Affects Free Cash Flow
SBC is Added Back to Operating Cash Flow (OCF):
Since SBC is a non-cash expense, it is deducted from Net Income on the Income Statement but added back when calculating Operating Cash Flow (OCF) under the indirect method of cash flow reporting.
This can make FCF appear higher, even though it does not actually generate cash.
Potential Dilution Impact:
While SBC increases FCF in the short term (since it's a non-cash expense), it leads to more outstanding shares over time, which can dilute earnings per share (EPS) and affect stock value.
Investors should be cautious when high SBC artificially boosts FCF while increasing share dilution.
Adjusted Free Cash Flow
To account for SBC’s impact, some investors use an Adjusted FCF metric:
Adjusted FCF = FCF − SBC
This adjustment gives a more conservative view of true cash generation by treating SBC as an actual cost to shareholders.
Let’s now take a look at Arista’s stock based compensation:
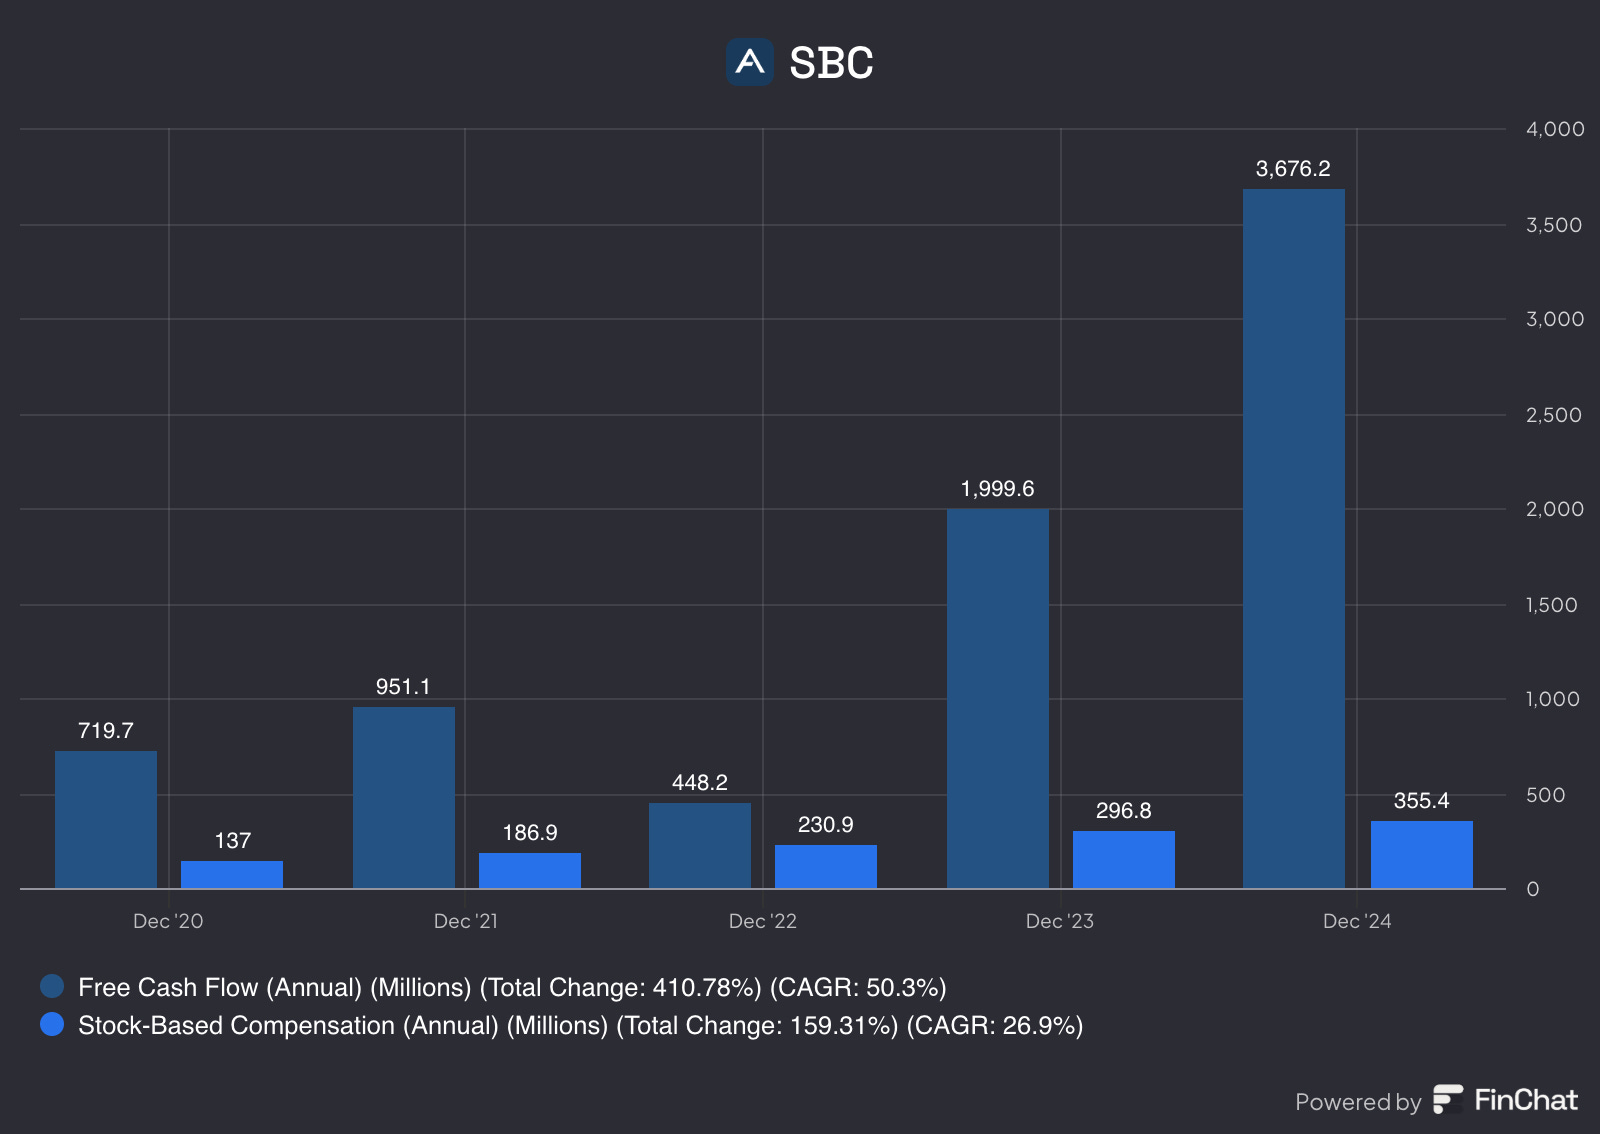
Arista has been issuing Stock-Based Compensation (SBC), which boosts its reported Operating Cash Flow (OCF) and, consequently, Free Cash Flow (FCF). However, SBC is increasing, which is a negative sign. But because they increased the gap between FCF and SBC, it indicates that SBC’s impact on FCF is gradually diminishing.
Buybacks
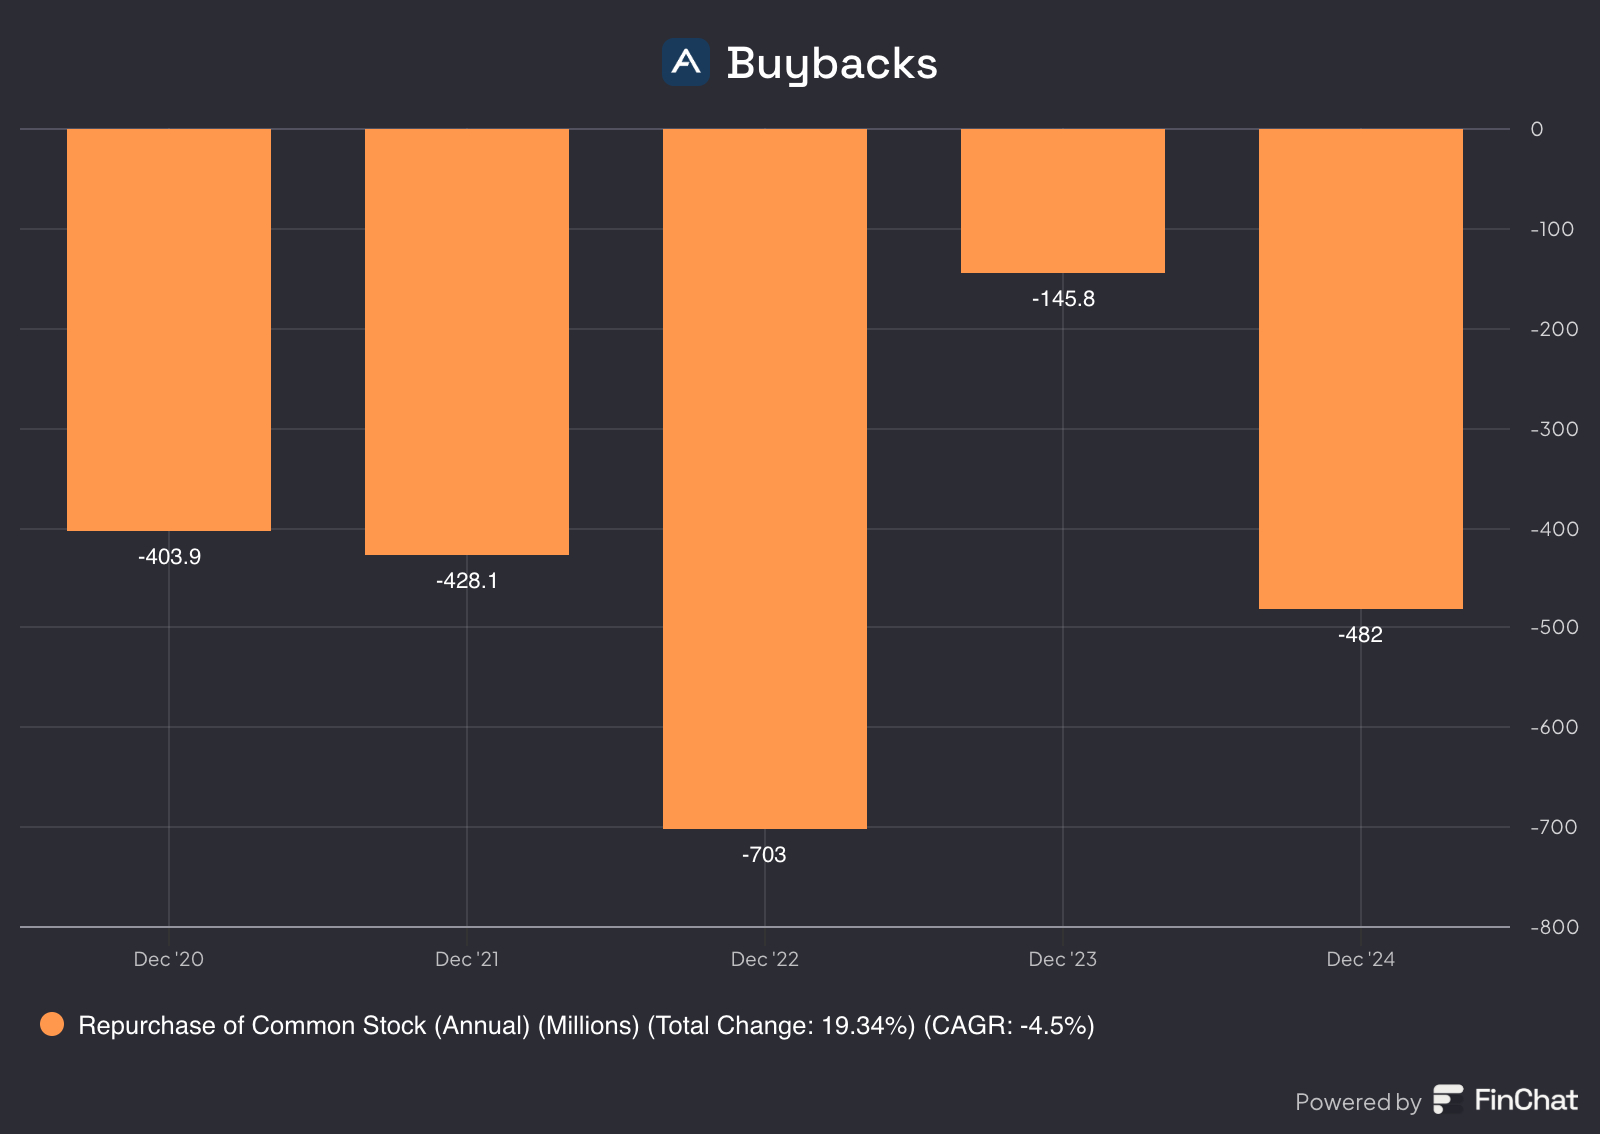
It appears that Arista has been buying back their shares over the last five years. Last year, they bought back around $482 million worth of shares out of a total of 235 million shares.
As an investor, share buybacks are generally seen as a positive sign because they can increase the value of the shares you currently own. They often indicate management’s confidence in the company’s future and can help drive long-term shareholder value.
Personally, I prefer a business that invests its money into assets rather than share buybacks. In Arista's case, they excel at capital allocation, with management consistently delivering strong returns, making asset investment the smarter choice for long-term growth.
That said, given their surplus cash of around $2,700 million, I understand why management also opts for buybacks. It’s a strategic move to enhance shareholder value when opportunities for reinvestment are limited.
Forward P/E
The Forward P/E chart for Arista, paints an exciting picture of growth, with the multiple soaring from a low of 6.12 to 43.31, marking a lively 64.34% total change and a steady 13% CAGR. Hitting a high of 49.15 and settling above the median of 28.94, it’s clear the market is buzzing with optimism, likely thanks to Arista’s strong presence in cloud and AI networking.
When I look at the Forward P/E, I always compare it to the stock’s historical median to get a sense of whether it’s undervalued or overvalued. But it’s also key to remember that this ratio is based on earnings, so if earnings are going down, the multiple can be pretty misleading. A low P/E might look attractive, but it doesn’t mean much if the business is struggling underneath.
Arista’s forward P/E is trading above its historical median, suggesting the stock may currently be overvalued based on this metric.

Forward P/FCF
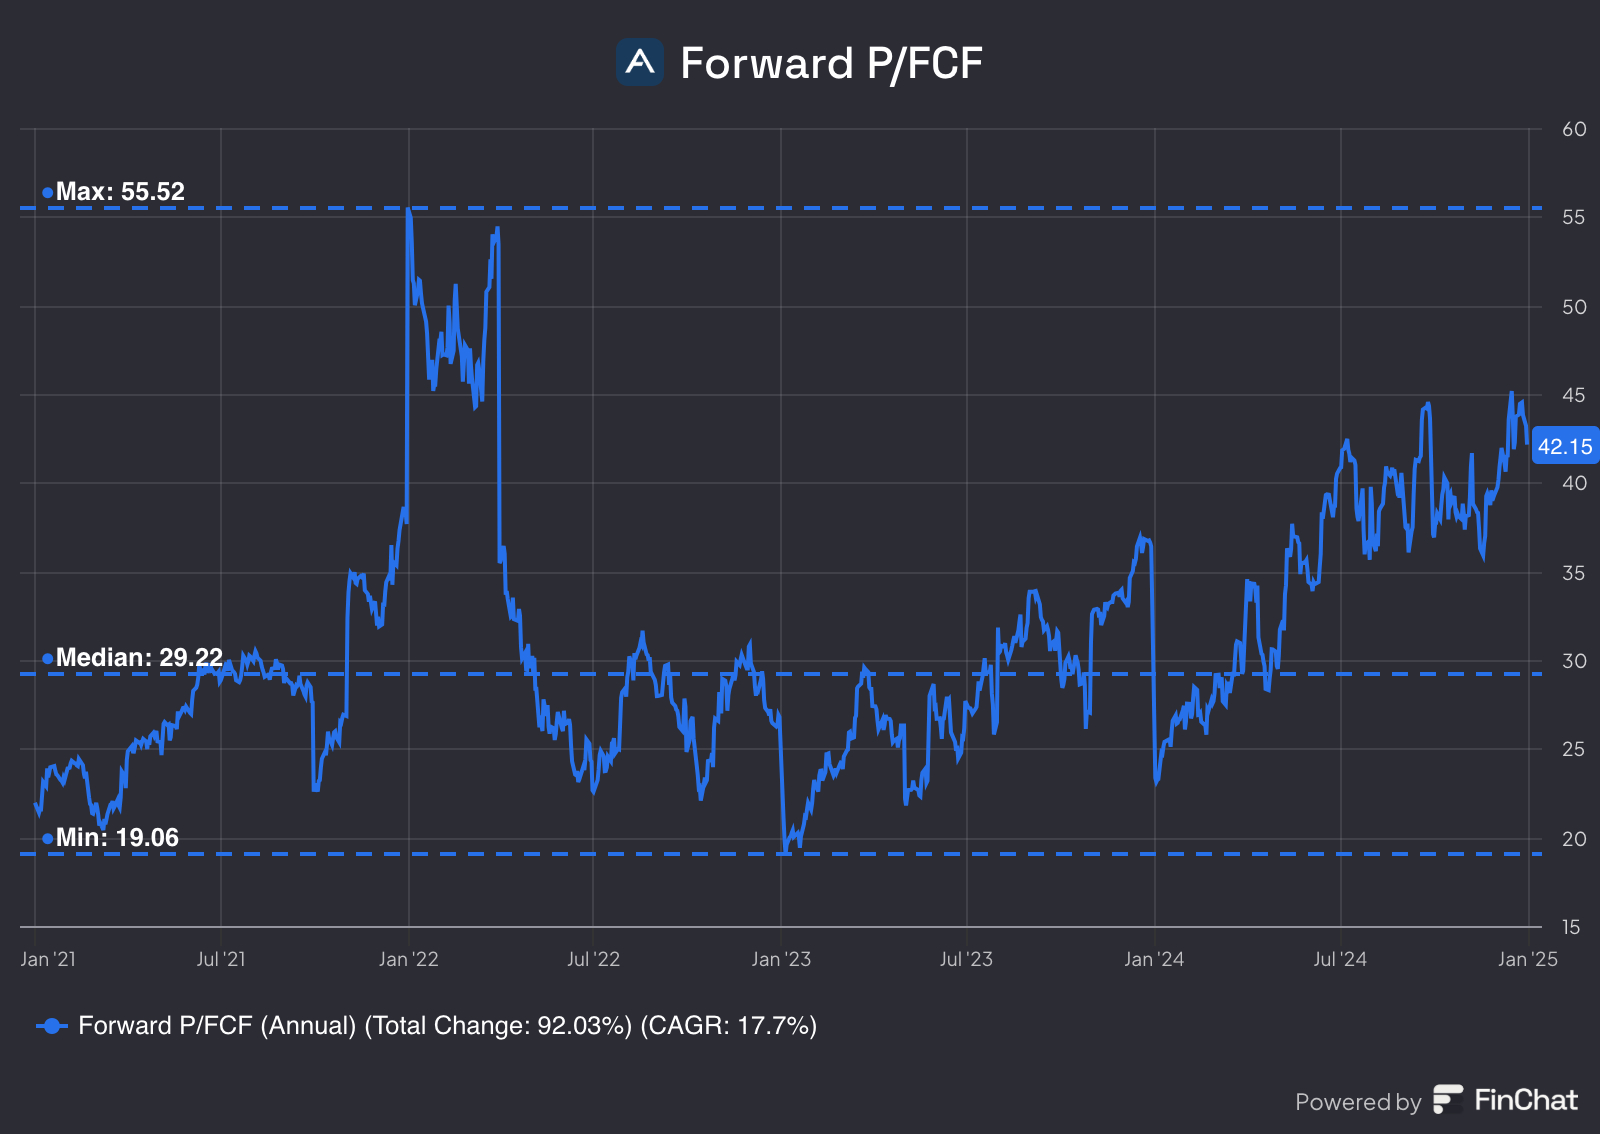
Arista Networks’ current forward Price-to-Free Cash Flow (P/FCF) sits at a lively 42.15, just above its historical median of 29.38, though still under its peak of 55.52, marking an exciting 92.02% rise since 2021 with a CAGR of 17.7%.
When I look at the Forward P/FCF, I always compare it to the stock’s historical median to get a sense of whether it’s undervalued or overvalued. But it’s also key to remember that this ratio is based on free cash flows, so if free cash flows are going down, the multiple can be pretty misleading. A low P/FCF might look attractive, but it doesn’t mean much if the business is struggling underneath.
Arista’s forward P/FCF is trading above its historical median, suggesting the stock may currently be overvalued based on this metric.
Forward EV/EBITDA
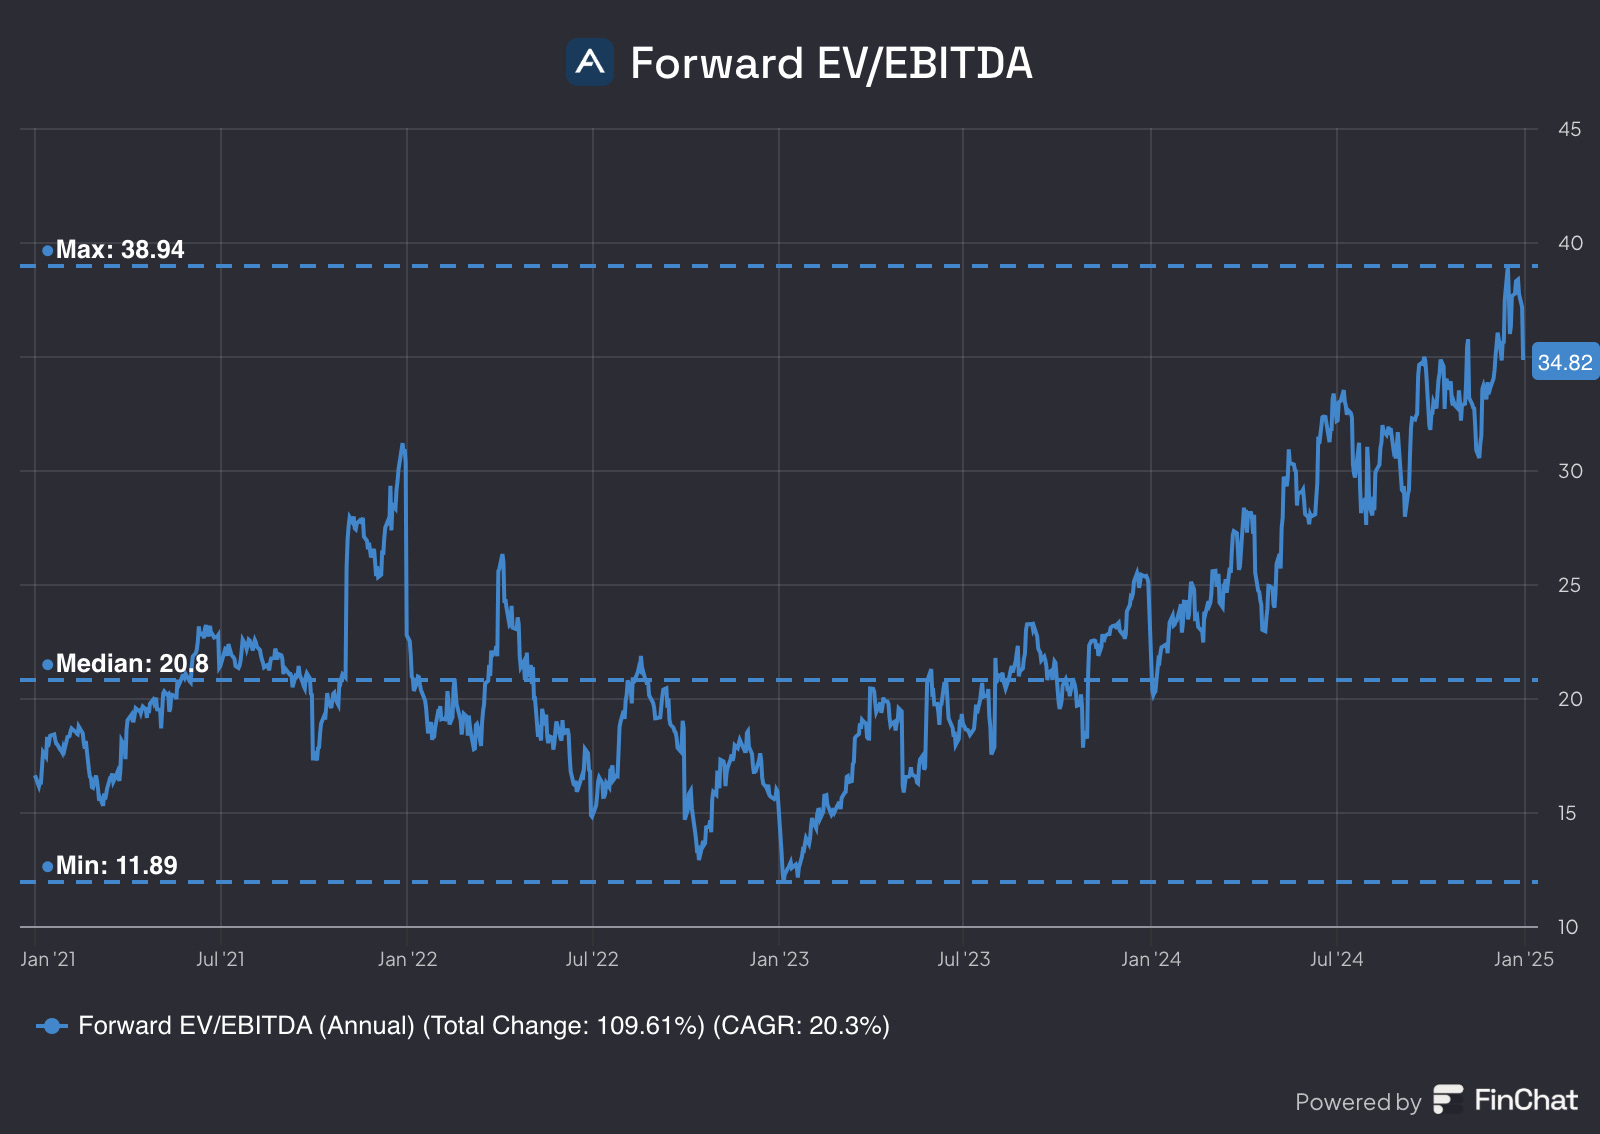
Arista Networks’ current forward EV/EBITDA ratio stands at 34.82, comfortably above its historical median of 20.8 and close to its peak of 38.94, marking an impressive 106.61% rise since 2021 with a CAGR of 20.3%.
However, just like with the P/E and P/FCF, the quality and trajectory of the underlying earnings (in this case, EBITDA) matter a lot, if those are weakening, the lower multiple could reflect justified concerns rather than an opportunity.
Arista’s forward EV/EBITDA is trading above its historical median, suggesting the stock may currently be overvalued based on this metric.
Earnings Growth Model
This model tells us the yearly expected return based on growth of the earnings and shareholder yield.
The formula looks like the following:
Expected return = EPS growth + dividend yield +/- multiple expansion (contraction)Here are the assumptions I use:
EPS Growth = 20% per year over the next 10 years
Dividend Yield = / (there is no dividend)
Forward PE to decrease from 43x to 29x (median) over the next 10 years
Expected return = 20% + 0 - 0.1*((29-43)/43))= 23%So, this means that we should be happy with a return of 23% per year.
In case of a 15% EPS growth, we get the following:
Expected return = 15% + 0 - 0.1*((29-43)/43))= 18%With an estimated 15% EPS growth, we should expect a 18% return per year.
In the past five years their EPS CAGR was 44%.
Reverse DCF
Finally, let’s do a reverse DCF on Arista Networks.

So, what does all of this mean?
For context, I chose a discount rate of 15% and not 10%, because I expect a higher annual return from my stocks compared to the average benchmark return (benchmark being the S&P500).
Basically, to justify a 15% annual return, Arista needs to grow FCF by 31.71%/yr.
Its 5-year historical FCF growth? 50%.
This means that at today’s price, Arista looks “undervalued” based on the metric that I’m using here.
2. Technical Analysis
In this second section, I’ll cover a short Technical Analysis on Arista.
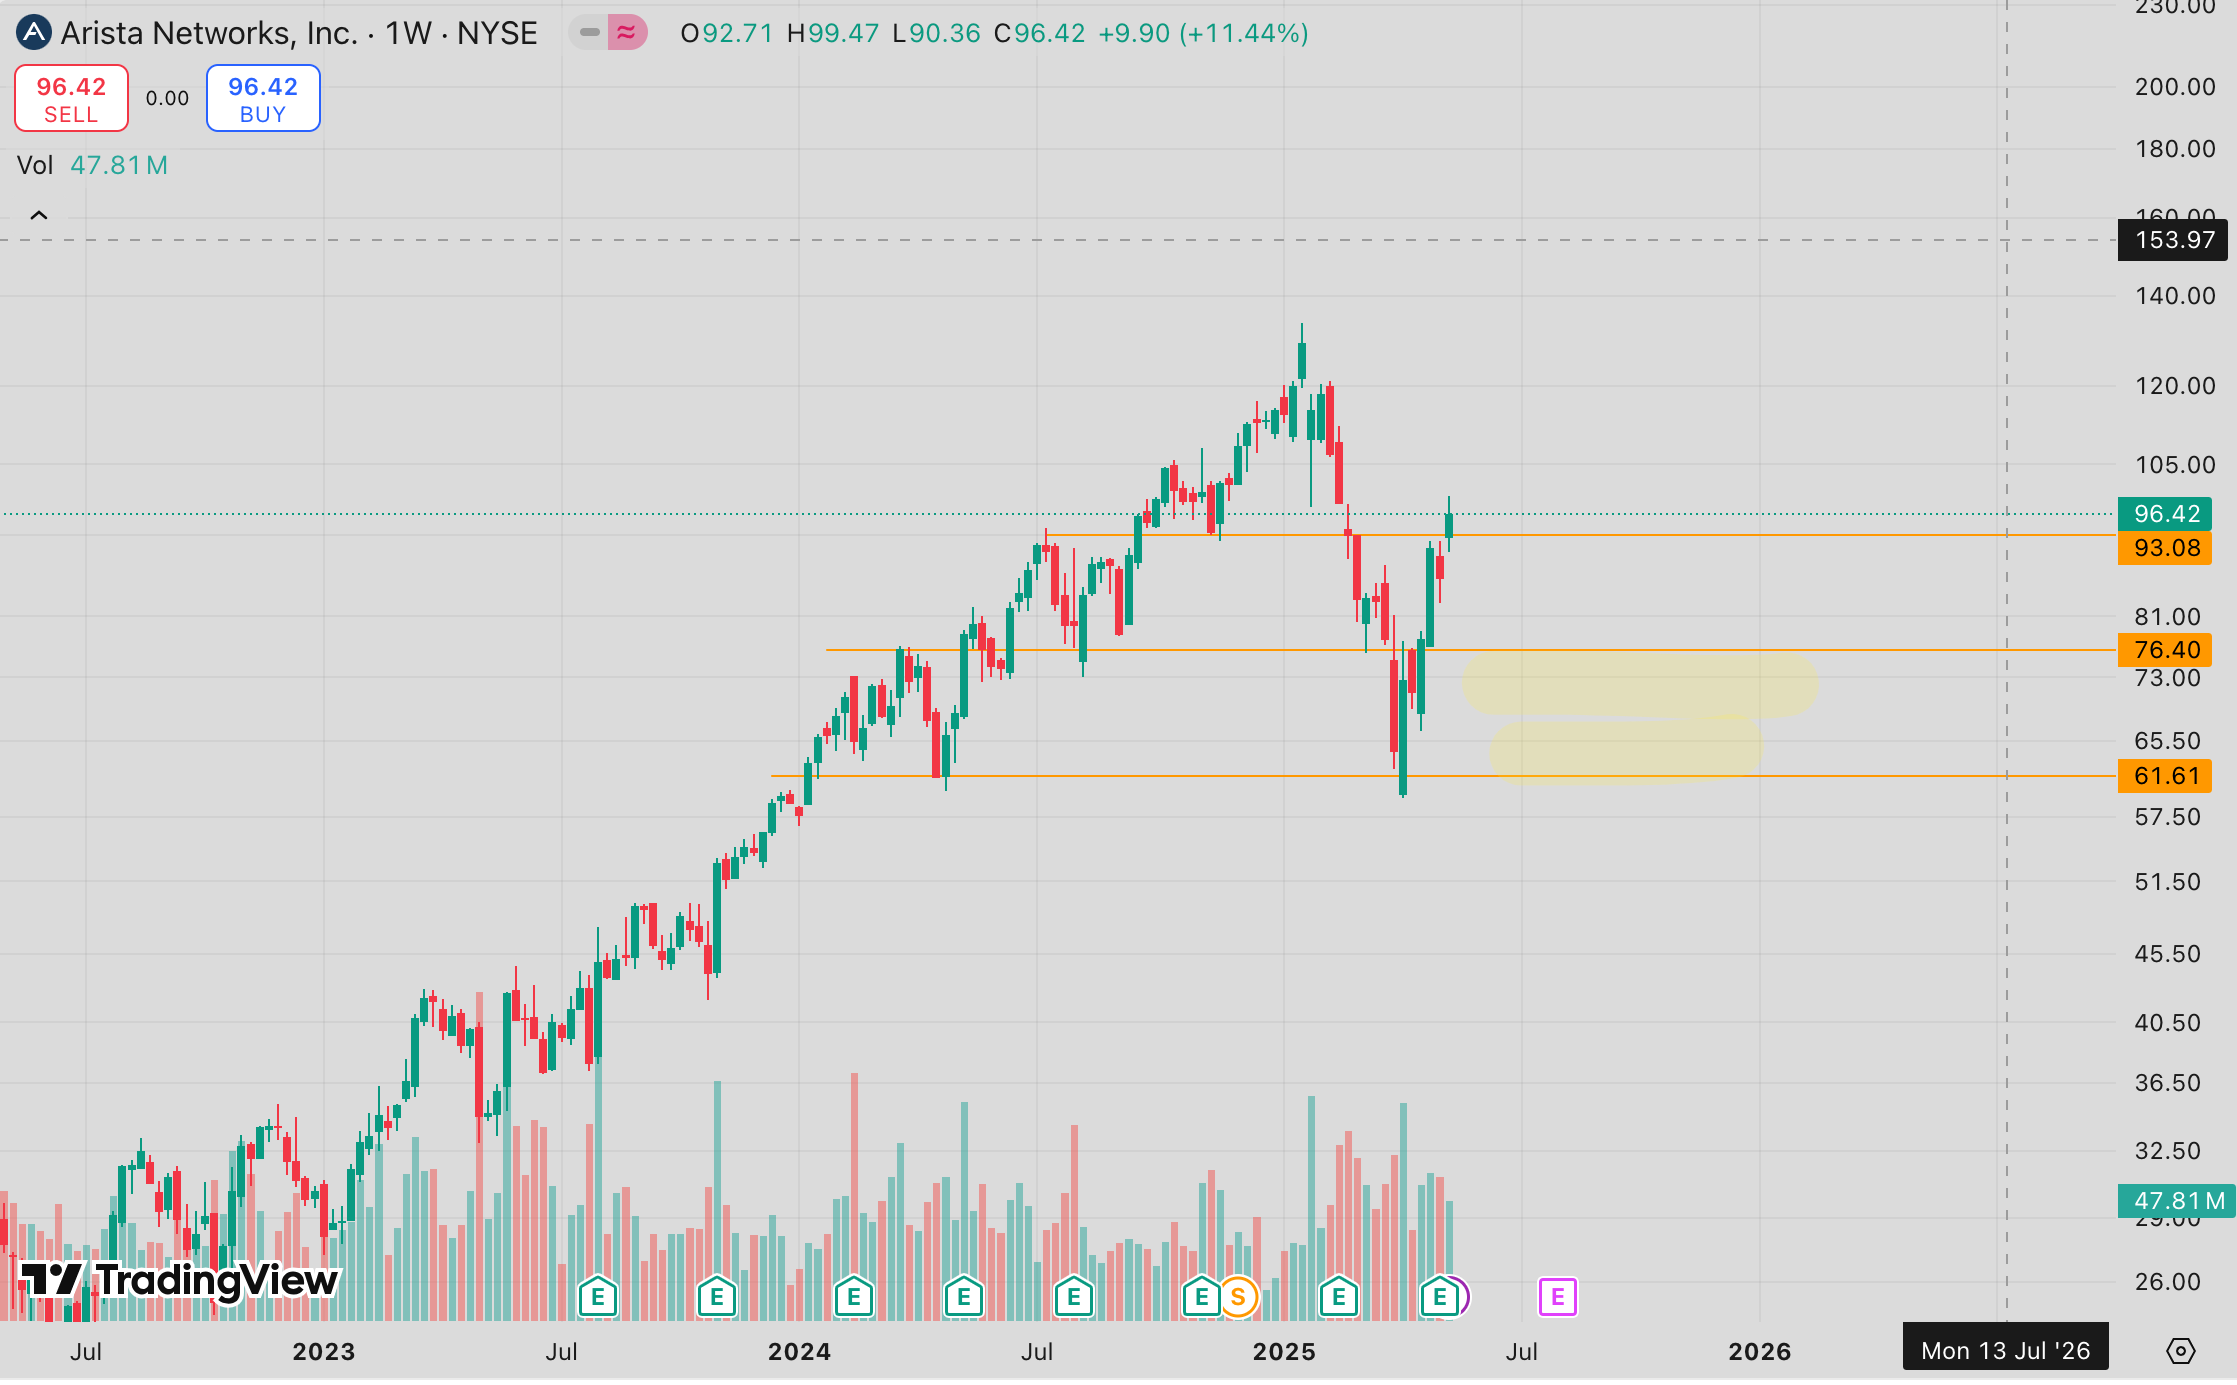
As you can see on this chart, Arista’s price is currently trading above the support line at $93. I’ve set out a BUY zone between $76 and $61. (To get a good starter position you’d like to get your first position to be around $61)
Conclusion
I believe Arista is currently a bit overvalued, and I’d like to see it come down to a more reasonable price before starting a position. Ideally, I want the multiples to drop closer to their historical median and the share price to enter the buy zone I've set. That said, I still think Arista is an excellent addition to any portfolio, thanks to its strong fundamentals and its strategic positioning in AI and Cloud.
If you haven’t checked out my previous post where I dive deeper into their business model and competitive moat, you can read it here:

Thank you for reading this article! If you enjoyed reading it, make sure to SUBSCRIBE so you don’t miss out any posts! And share, leave a comment!
If you enjoyed reading this article, you might enjoy these other ones to:


Disclaimer:
The content of this analysis is for informational purposes only and should not be considered financial or investment advice. The opinions expressed are my own and based on publicly available information at the time of writing. Before making any investment decisions, please conduct your own research or consult with a professional financial advisor to assess your individual situation. Investing in the stock market involves risk, and past performance is not indicative of future results.
Disclosure: I’m not invested in this business.
Hey Felix, Nice write-up. Just one comment - I think your earnings growth model formula is wrong. You should not have "-" for multiple contraction. You showed a 23% return:
Expected return = 20% + 0 - 0.1*((29-43)/43))= 23%
But it should have been 17% as shown below:
Expected return = 20% + 0 + 0.1*((29-43)/43))= 17%
MoAT manifests in ROA.
.
1.
NYSE: Arista Networks's ROA
= 100×3.03÷14.51
= 20.88 %, with 40.73% Net Profit Margin, remarkable
.
2.
.
KLSE: Infoline TEC Group's ROA
= 18.79 % with 17.2 Net Profit Margin
.
The Net Profit Margin will improve to 30% (FYE2025) from 17.2% (FYE2024), due to its MNC clients are willing to pay for Cybersecurity and managed services with very high gross profit margin.
.
With the trend of revenue growth and spike of NPM, the forward ROA of Infotec is extrapolated > 32%.
.
And the quoted price is very under valued, MOS 36%.
.
Anyone invests in ASEAN stock?