


Fundamentals meet Technicals: Hims & Hers Health Inc.
A Fundamental and Technical Analysis.


So, today we’ll discuss whether Hims seems like a stock to keep an eye on or not.
Overview
Today, I’ll cover the following of Hims:
Fundamental Analysis
Technical Analysis
This is also the framework that I’ll be using when doing a Deep Dive into any company that might be ready to BUY.
If you’re interested in seeing more of these Deep Dives where I discuss a companies Fundamentals and Technicals, make sure to SUBSCRIBE so you don’t miss any FREE insights!
1. Fundamental Analysis
In the next section, I’ll discuss the following things:
General Overview (Total Revenues, Net Income, EBIT, Free Cash Flow)
KPI’s
Skin in the game
Gross Profit and Net Income Margin
ROIC
Goodwill
Capex (Maintenance/Growth)
Stock-Based Compensation
Buybacks
Forward P/E
Forward P/FCF
Earnings Growth Model
Reverse DCF
General Overview
In this first part, I’ll discuss the overall fundamentals of the business: Total Revenues, Net Income, EBIT, Free Cash Flow.
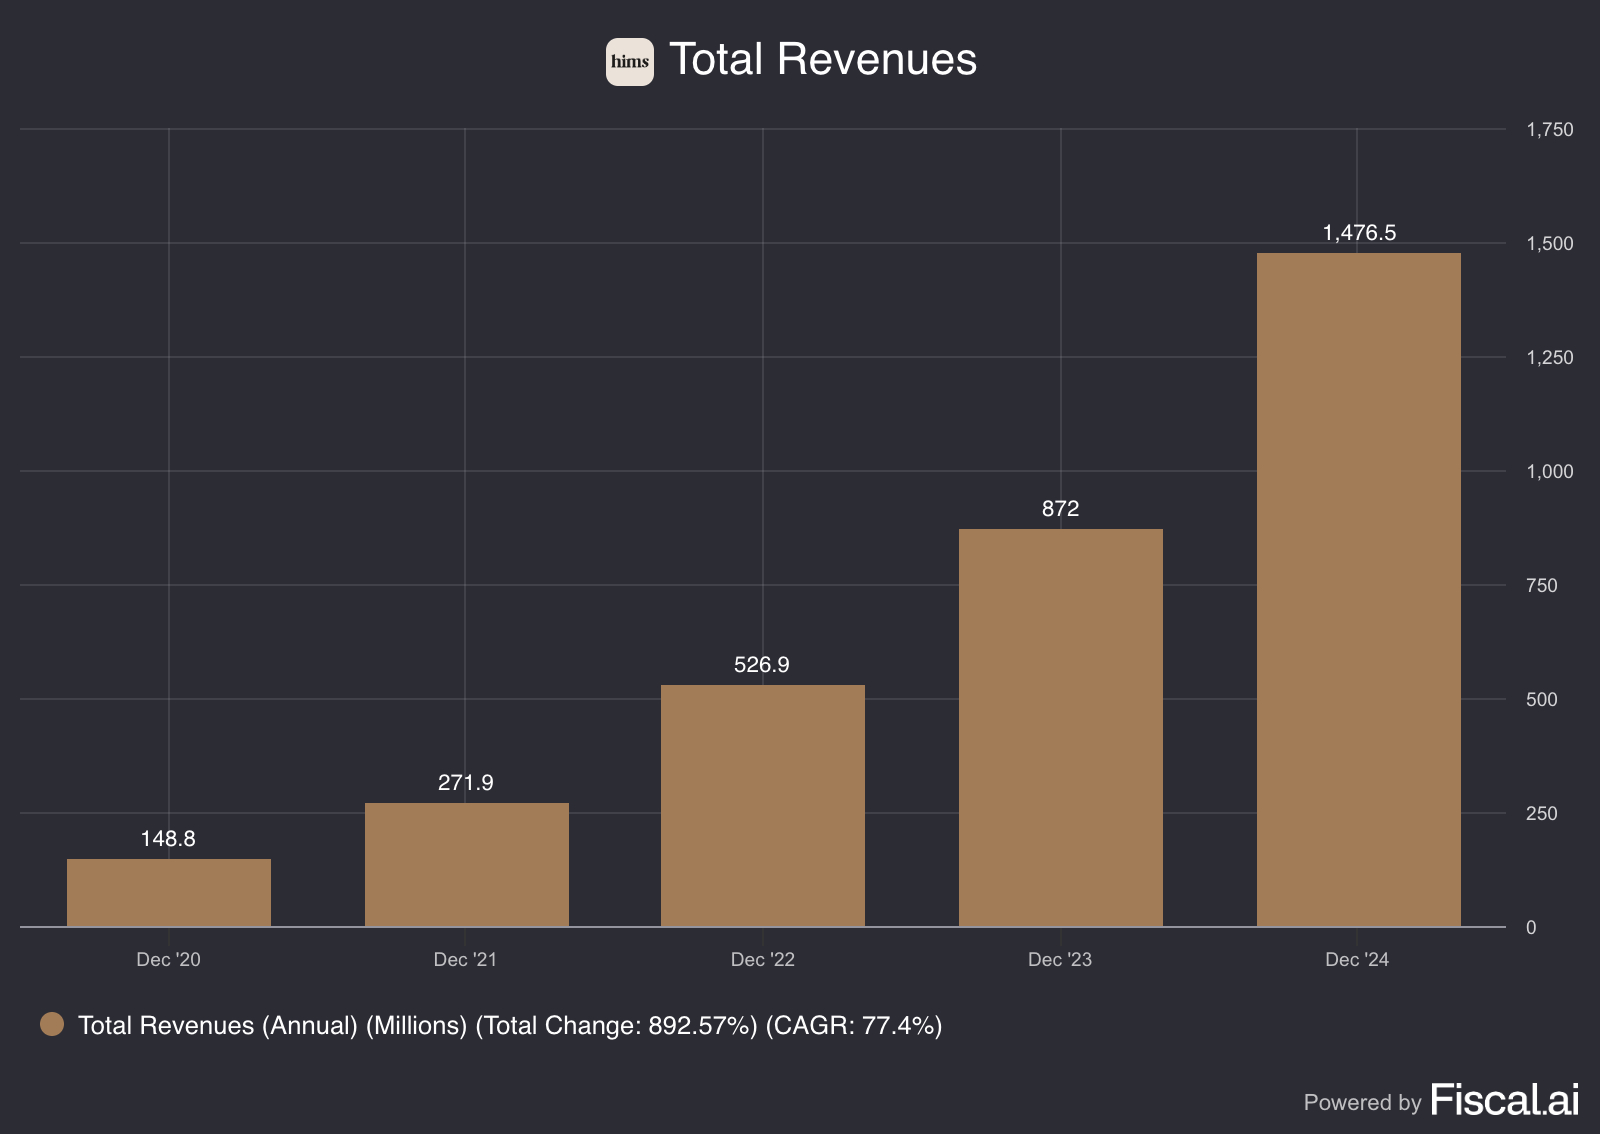
Total Revenues
Hims & Hers' revenue performance from 2020 to 2024 demonstrates explosive growth as the digital health platform scaled from $148.8 million to $1.48 billion in revenue. The company experienced steady acceleration through 2022-2023, then achieved a breakthrough in 2024 with 69% year-over-year growth driven by expansion in weight management solutions and subscriber growth to 2.2 million customers.
This represents an extraordinary 892% total increase over four years, translating to a 77.4% compound annual growth rate. The growth pattern reflects Hims' successful evolution from a niche men's health startup focused on erectile dysfunction and hair loss treatments into a comprehensive digital health ecosystem encompassing women's health, mental wellness, and notably GLP-1 weight management medications.
The company's momentum continues with 2025 guidance projecting $2.3-2.4 billion in revenue, indicating sustained acceleration as it capitalizes on growing demand for accessible, stigma-free telehealth solutions.
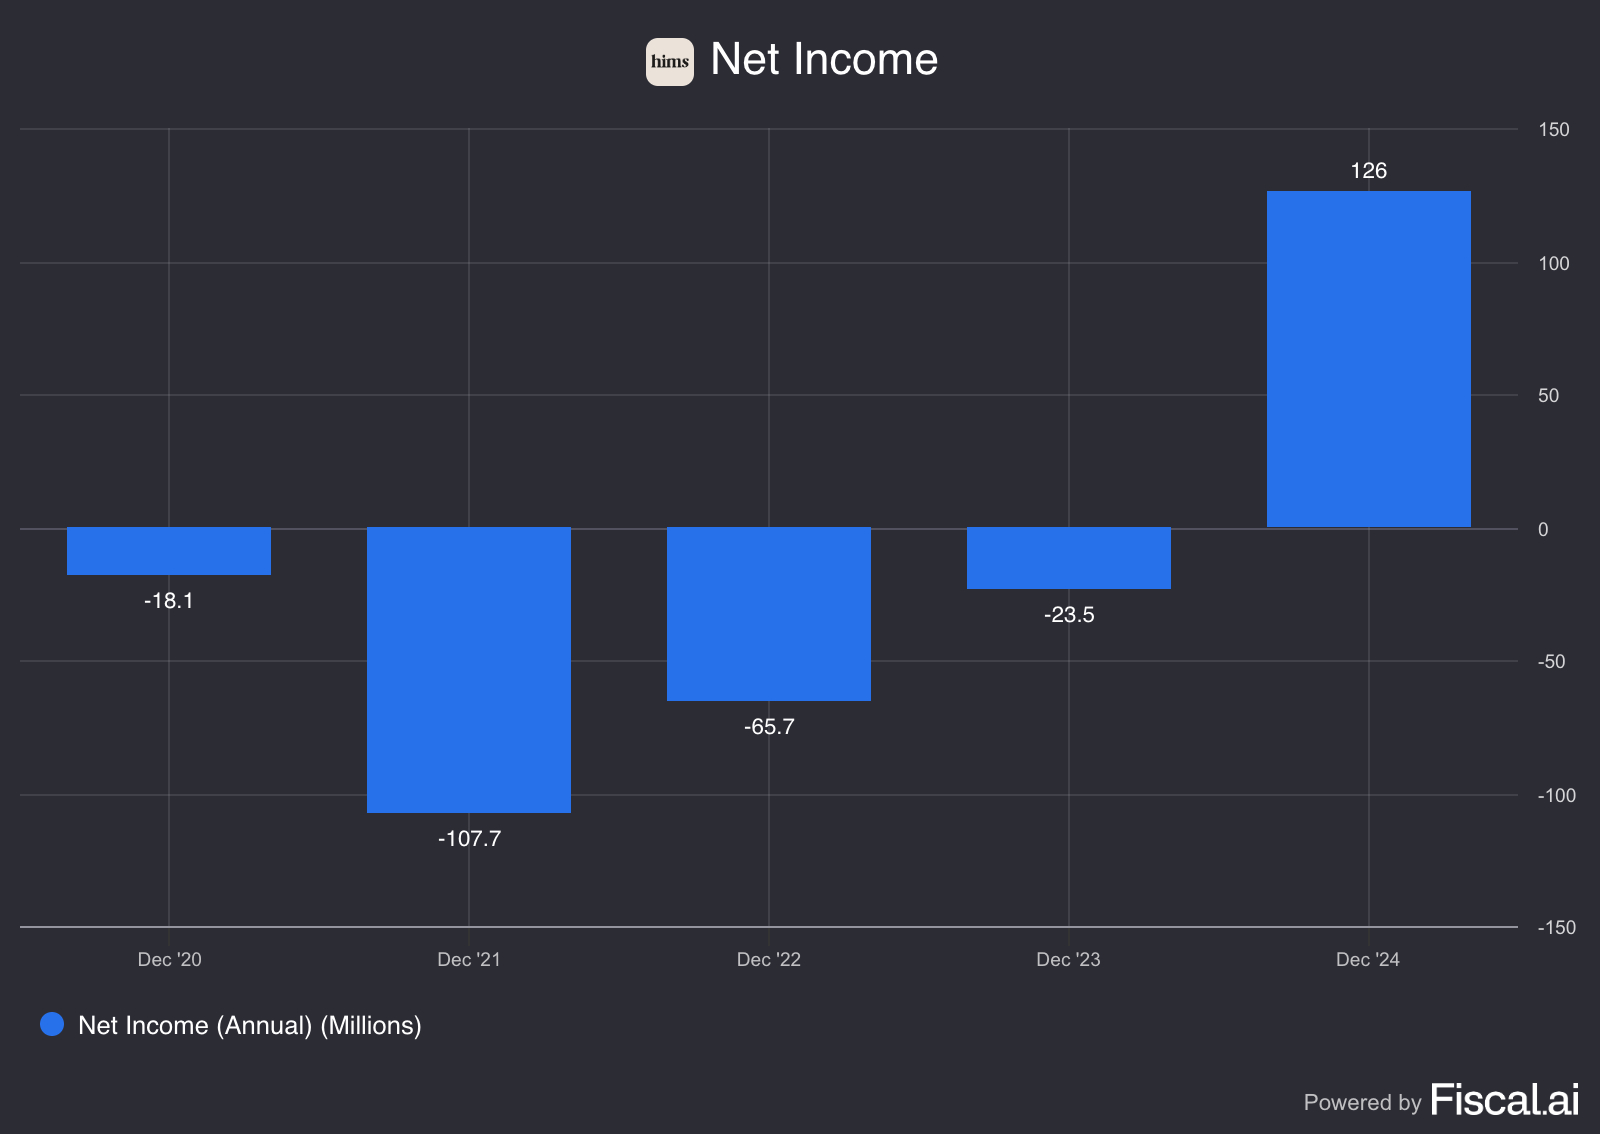
Net Income
Hims’ net income trajectory shows a clear path from startup losses to profitability over five years. The company recorded losses of $18.1 million in 2020, deepening to $107.7 million in 2021 before gradually improving to $65.7 million in 2022 and $23.5 million in 2023.
The dramatic turnaround occurred in 2024 with net income of $126 million, representing a $149.5 million improvement from the previous year. This swing from a $23.5 million loss to $126 million profit demonstrates the company's successful transition to profitability while maintaining rapid revenue growth.
The five-year progression from -$18.1 million to +$126 million reflects operational leverage taking effect, with the company achieving sustainable profitability after four years of cumulative losses totaling approximately $215 million during its growth investment phase.
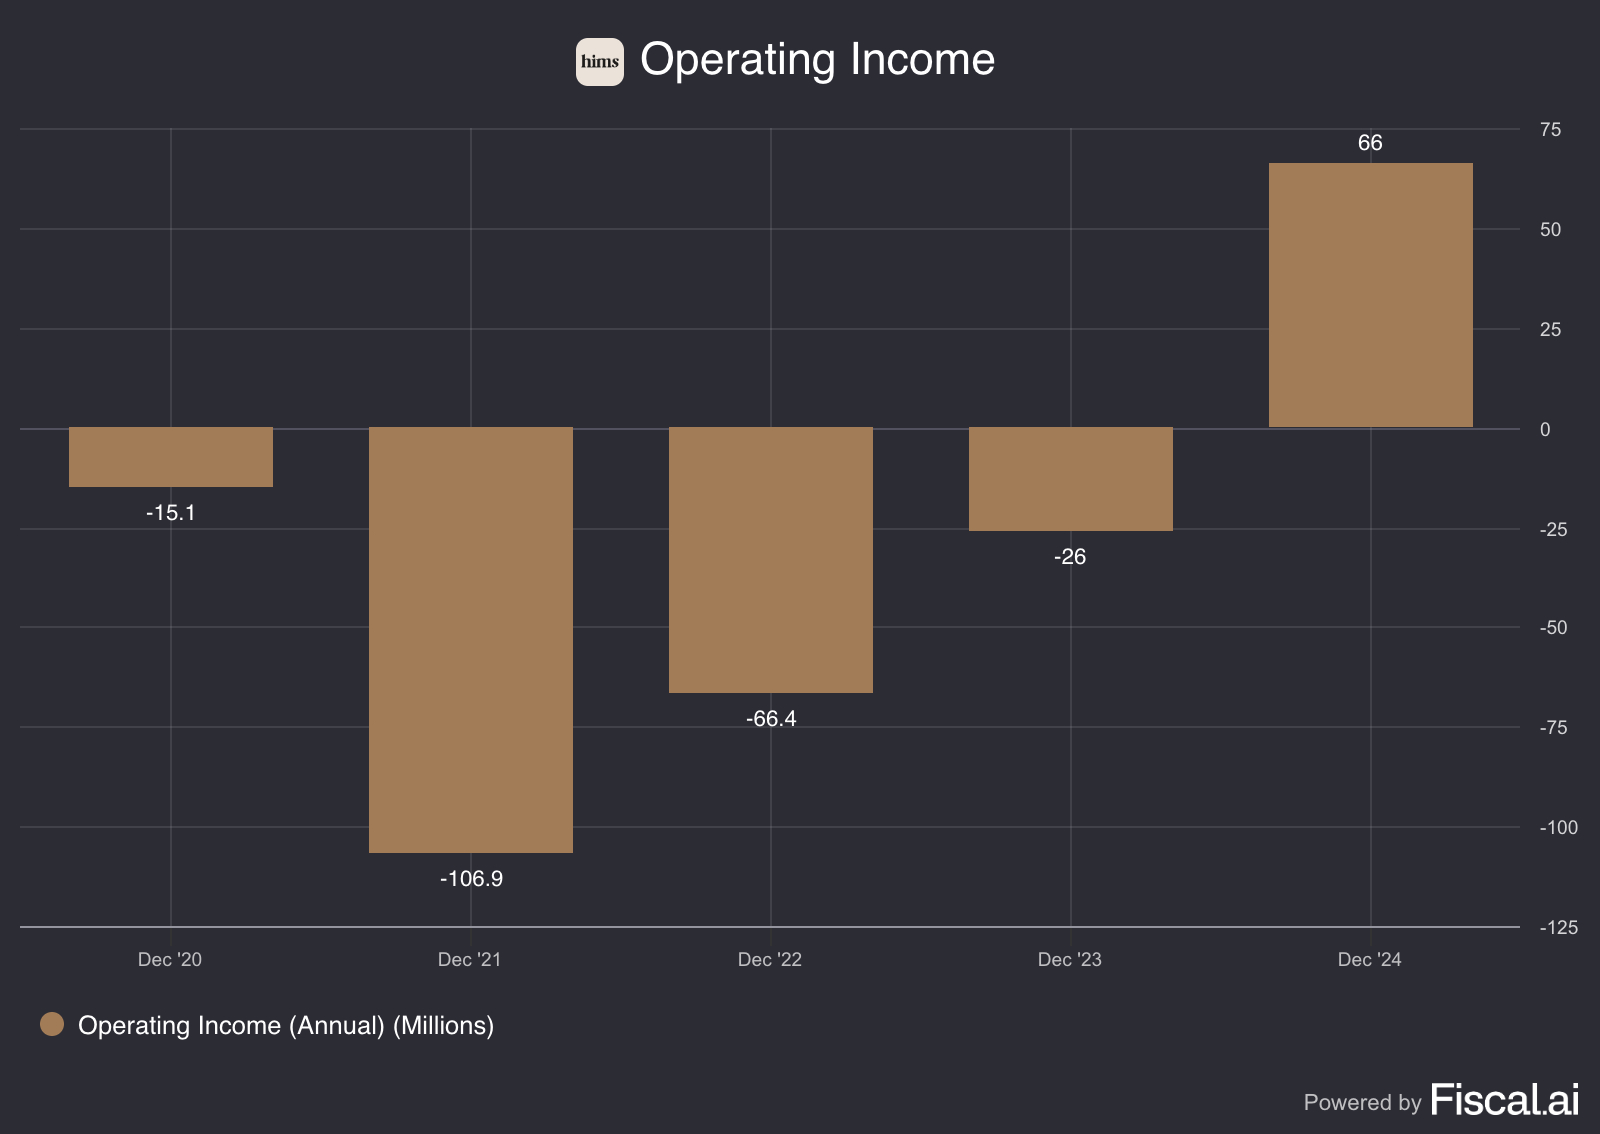
EBIT/Operating Income
The operating income shows a volatile path to profitability, starting with a $15.1 million operating loss in 2020 that expanded dramatically to $106.9 million in 2021 during peak investment mode. The company saw continued losses of $66.4 million in 2022 and $26 million in 2023, but achieved a remarkable turnaround in 2024 with $66 million in operating income.
The $92 million year-over-year improvement from 2023 to 2024 represents the company's successful transition from burning cash on operations to generating substantial operating profits. This swing from -$26 million to +$66 million demonstrates that Hims has achieved operational efficiency while scaling revenue, with the business now generating meaningful cash flow from its core operations.
The five-year progression from -$15.1 million to +$66 million in operating income reflects the company's ability to leverage its platform investments and achieve sustainable operating profitability after absorbing cumulative operating losses of approximately $214 million during its growth phase.
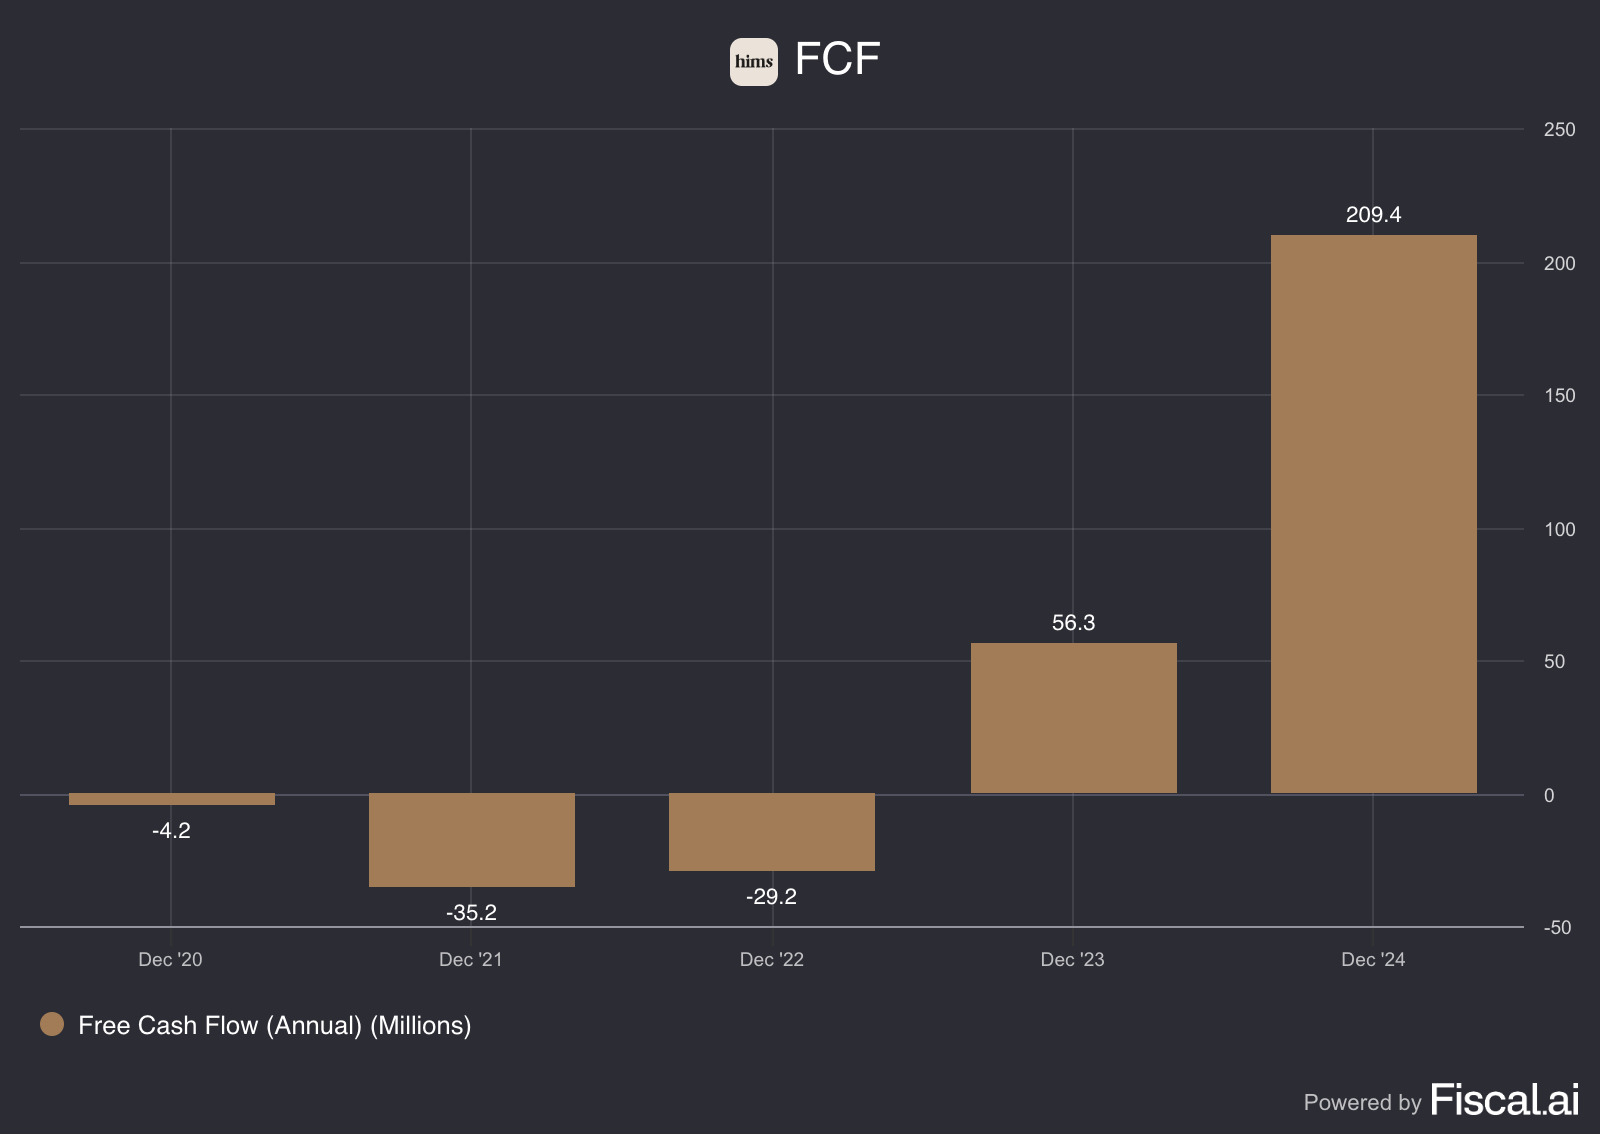
Free Cash Flow
Free cash flow demonstrates a steady progression from cash burn to strong cash generation. The company started with negative $4.2 million in 2020, which worsened to $35.2 million in 2021 and $29.2 million in 2022 as it invested heavily in growth initiatives and infrastructure.
The inflection point began in 2023 with positive free cash flow of $56.3 million, marking the company's first year of cash generation. This momentum accelerated dramatically in 2024, reaching $209.4 million in free cash flow, a $153.1 million improvement from the previous year.
The transformation from -$29.2 million in 2022 to +$209.4 million in 2024 represents a $238.6 million swing in just two years, showcasing the company's ability to convert its revenue growth into substantial cash generation. This free cash flow performance indicates strong working capital management and operational efficiency, positioning Hims & Hers with significant financial flexibility for future investments and growth initiatives.
If you like seeing the charts I use, you should definitely go and check out Fiscal.ai. It’s a free to use stock research tool. If you like it, feel free to check it out through my link:
https://finchat.io/pricing/referralCode=eU7MvaPHfoU2sG5QDaSoUYVvpEb2
(Ps: I don’t get any money out of this, I just get to Unlock Pro for free for 1 month for every user I refer to FiscalAI)
KPI’s
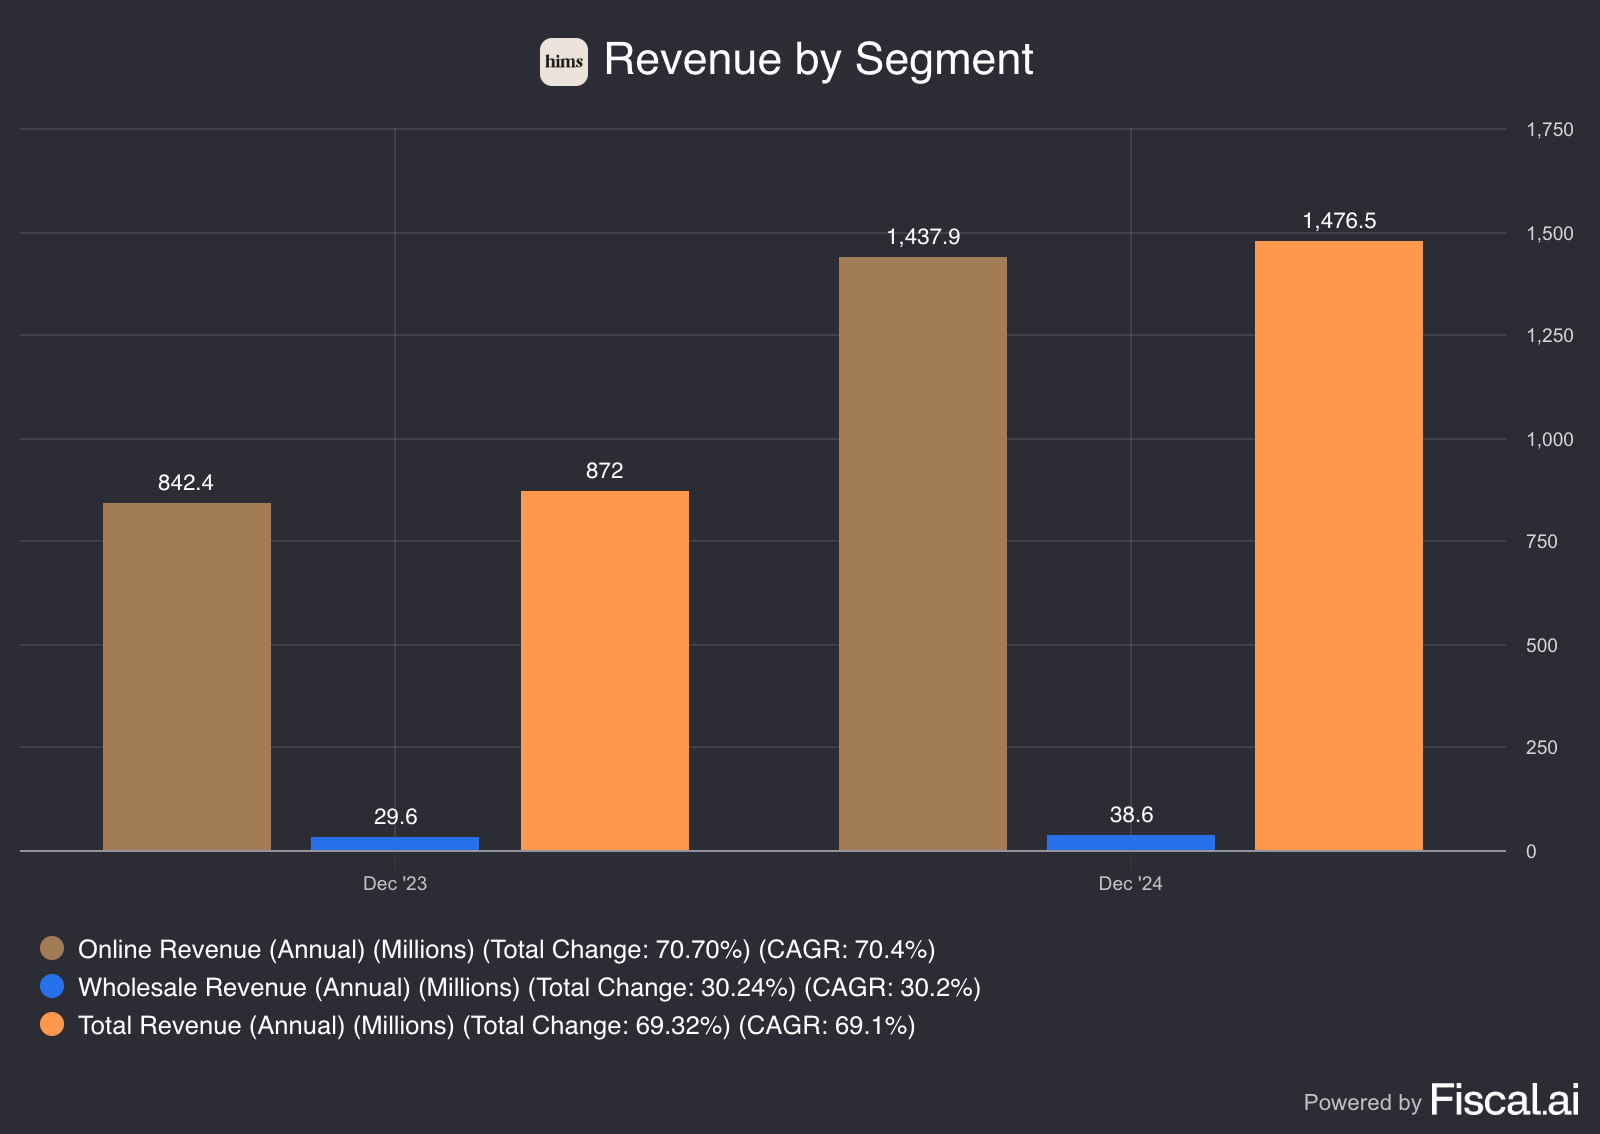
Hims' revenue breakdown reveals a business model heavily dominated by online revenue with minimal wholesale operations. Online revenue drove the majority of growth, increasing from $842.4 million in 2023 to $1,437.9 million in 2024, representing a 70.7% year-over-year increase and contributing 97.4% of total revenue.
The wholesale segment remains a small but growing component, rising from $29.6 million to $38.6 million, a 30.2% increase that added $9 million in additional revenue. However, wholesale represents only 2.6% of total revenue, demonstrating Hims & Hers' focus on direct-to-consumer operations.
Total revenue reached $1,476.5 million in 2024, up 69.3% from $872 million in 2023, with online revenue accounting for $595.5 million of the $604.5 million total increase. This segmentation shows the company's success in scaling its core digital health platform while maintaining its direct-to-consumer model as the primary growth driver, with wholesale serving as a complementary but minor revenue stream.
Another interesting KPI, is the following one:
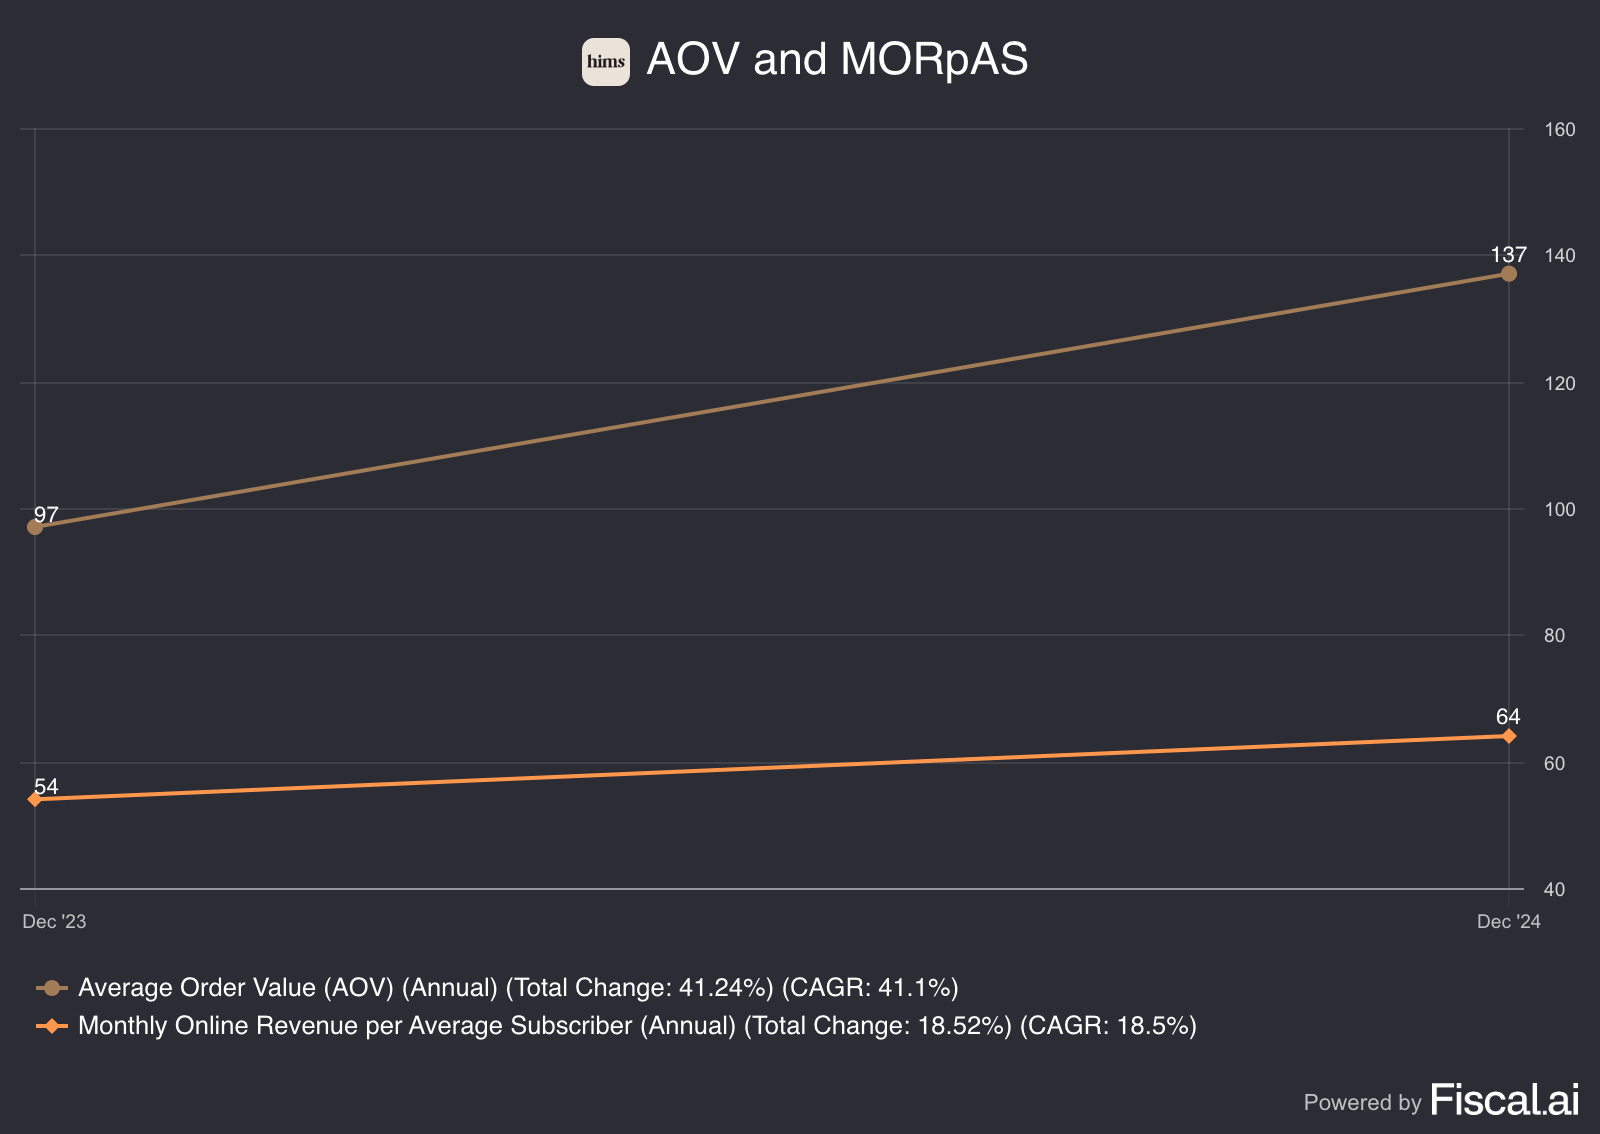
Hims & Hers' key unit economics metrics show strong improvement across both customer value and revenue efficiency from 2023 to 2024. Average Order Value (AOV) increased significantly from $97 to $137, representing a 41.2% growth that indicates customers are purchasing higher-value products or larger quantities per transaction.
Monthly Online Revenue per Average Subscriber (MORpAS) grew from $54 to $64, an 18.5% increase demonstrating improved monetization of the existing subscriber base. This metric suggests the company is successfully driving higher spending frequency or expanding product adoption among its customer base.
The divergence between AOV growth (41.2%) and MORpAS growth (18.5%) indicates that while customers are spending more per order, the frequency of purchases may have moderated slightly, or the subscriber base expanded faster than revenue growth. Both metrics trending upward signals healthy unit economics with customers demonstrating increased engagement and spending power within the Hims & Hers ecosystem.
If you like what you are reading thus far, make sure to SUBSCRIBE so you don’t miss any posts!
Skin in the game
"Skin in the game" matters for investors evaluating management commitment.
Hims&Hers Health Inc. (HIMS) has insider ownership of just around 13%, well above the ideal 10% benchmark that typically aligns management incentives with shareholders.
This high ownership signals high personal commitment from leadership, potentially strengthening accountability and long term thinking.
Gross Profit and Net Income Margin
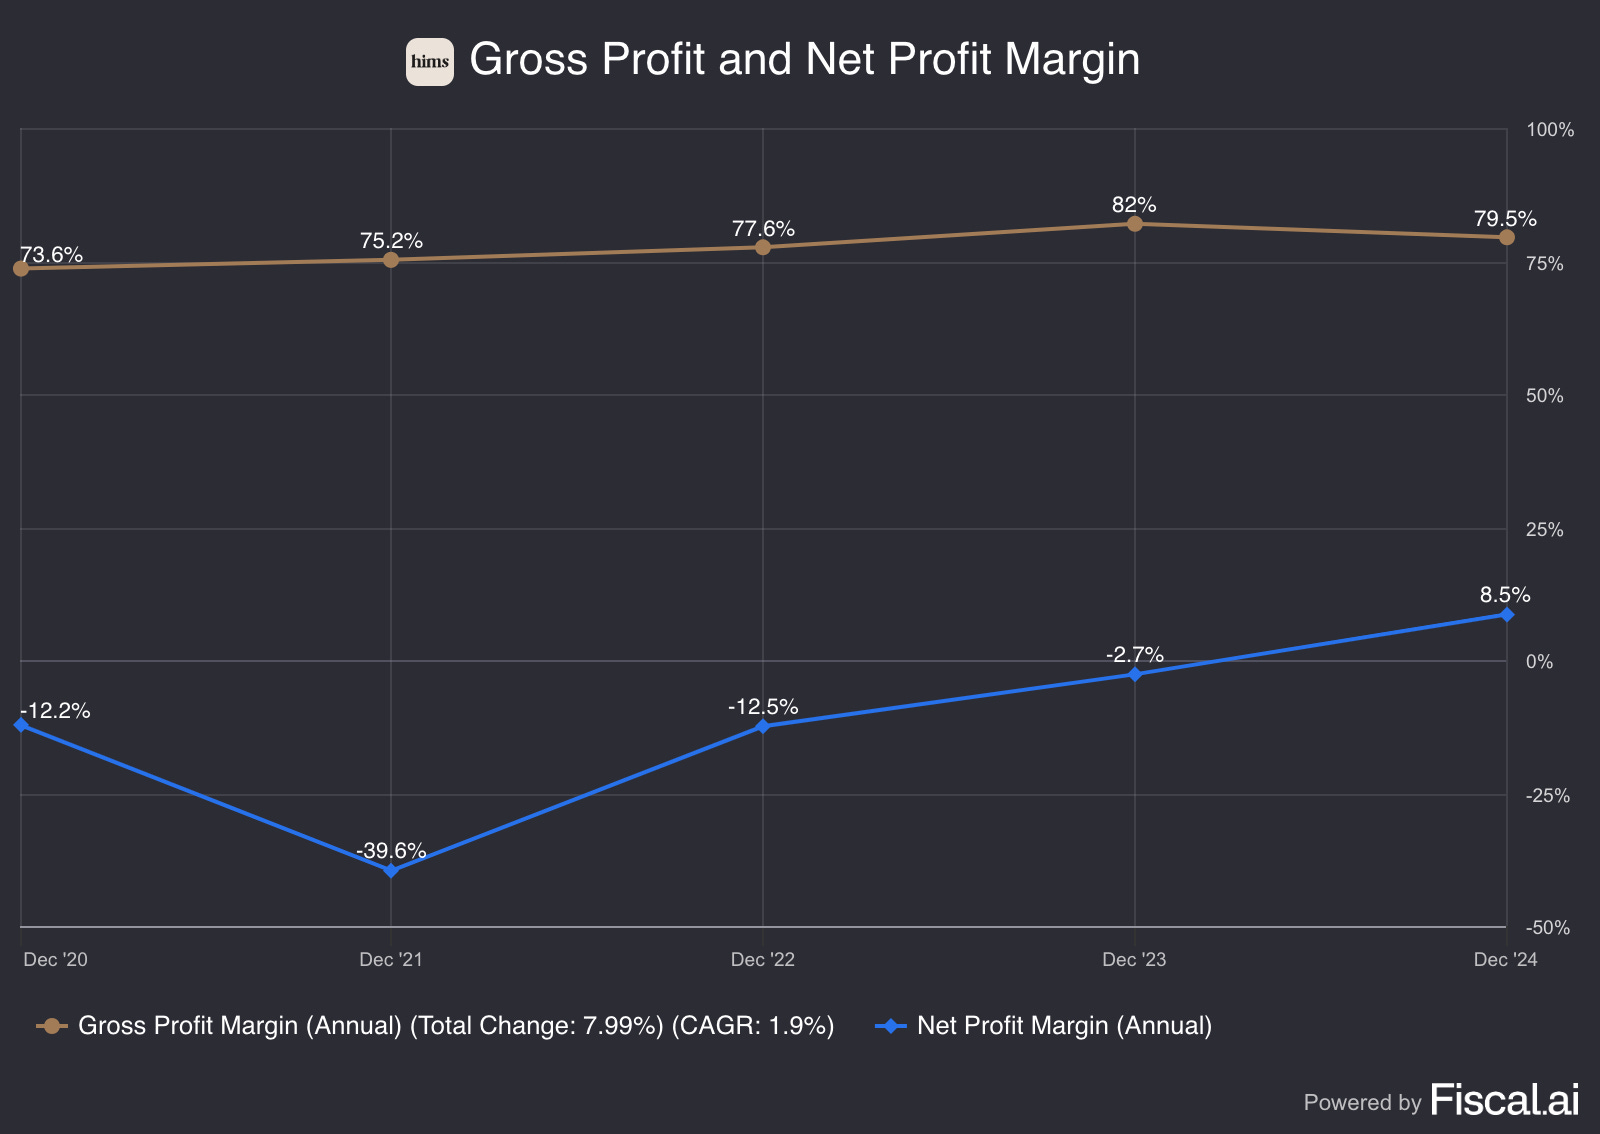
The margin profile shows steady gross profit margins with a dramatic transformation in net profitability. Gross profit margins remained consistently strong, ranging from 73.6% to 82% over the five-year period, with a peak of 82% in 2023 before moderating to 79.5% in 2024, representing a modest 7.99% total improvement.
The net profit margin story is far more dramatic, starting at -12.2% in 2020 and plummeting to -39.6% in 2021 during peak investment mode. The company then steadily improved profitability, reaching -12.5% in 2022, -2.7% in 2023, and achieving positive 8.5% net margins in 2024.
This represents a remarkable 47.1 percentage point improvement from 2021 trough to 2024. The divergence between stable gross margins and improving net margins demonstrates the company's success in achieving operational leverage, maintaining healthy unit economics while dramatically reducing operating expenses as a percentage of revenue. The 2024 result shows Hims & Hers has successfully transitioned from a loss-making growth company to a profitable, scaled business.
If you need more information on Hims’ Business Model, and specifically in depth information on where most of their revenue is coming from, go and check out this article:

Return on Invested Capital (ROIC)
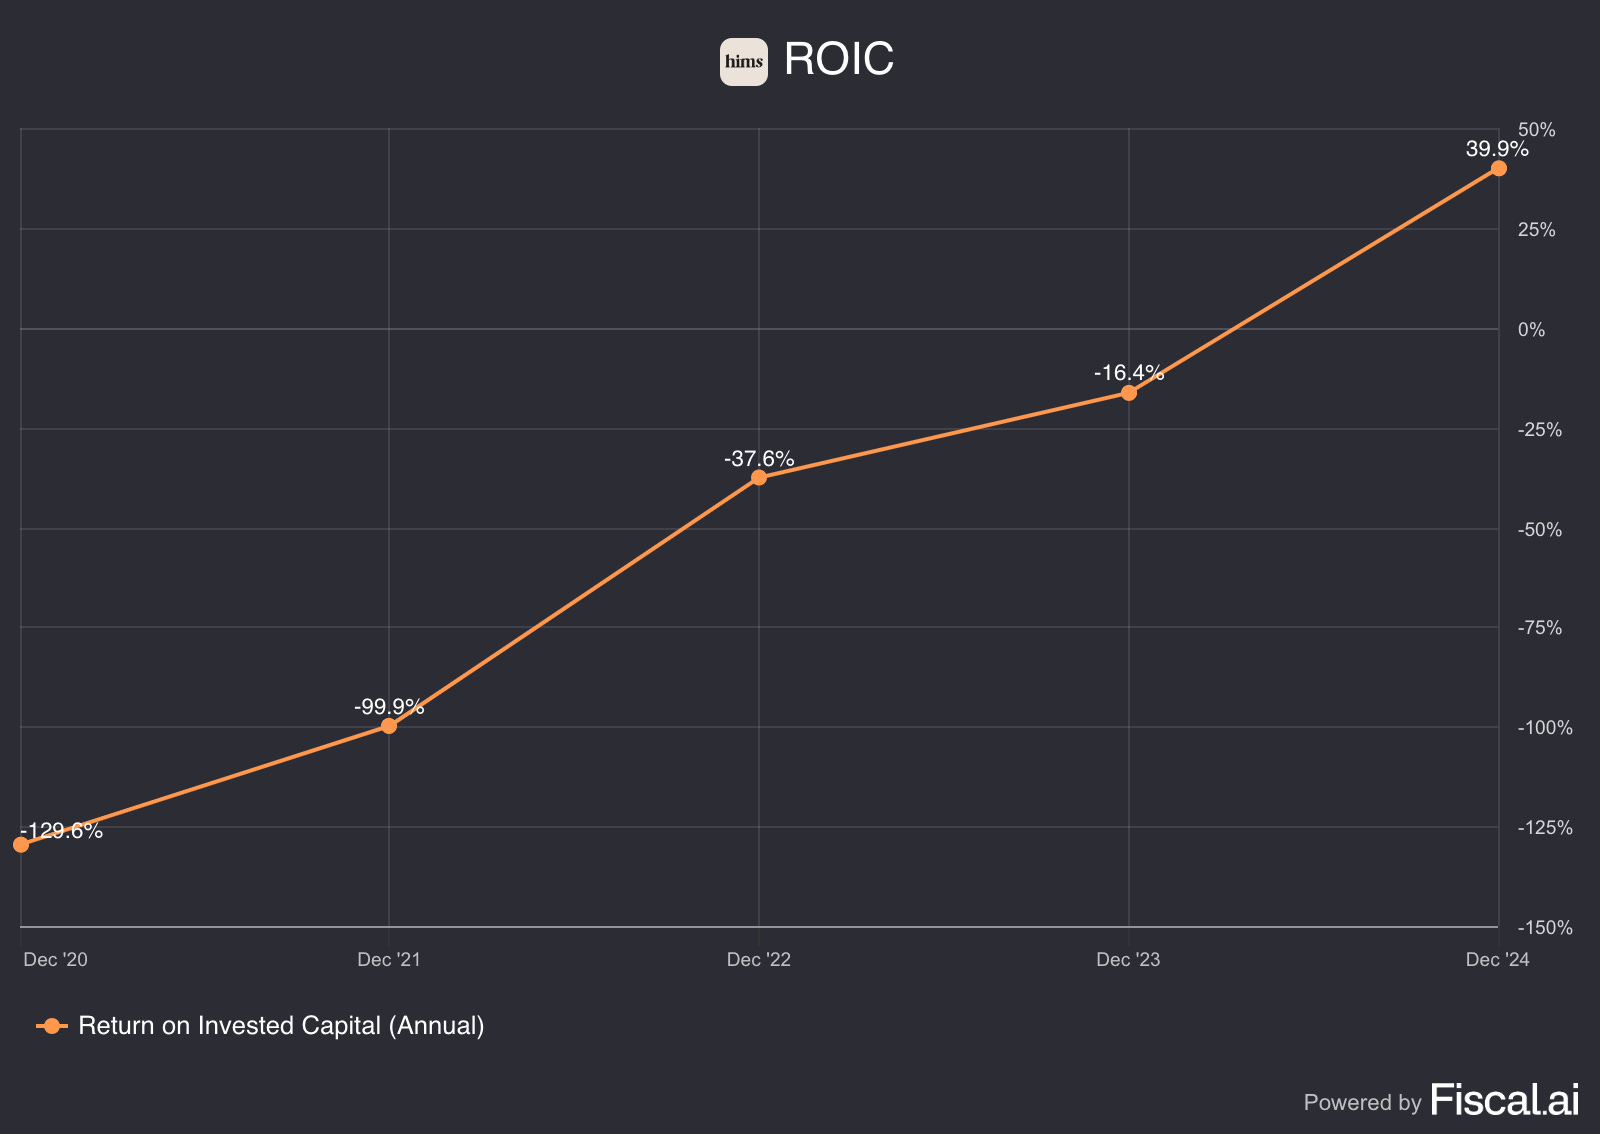
Over the past few years, Hims’ return on invested capital (ROIC) has augmented significantly, indicating that the company is making extremely good investment decisions.
A 39.9% ROIC is crazy. It shows, how efficient management is able to allocate capital.
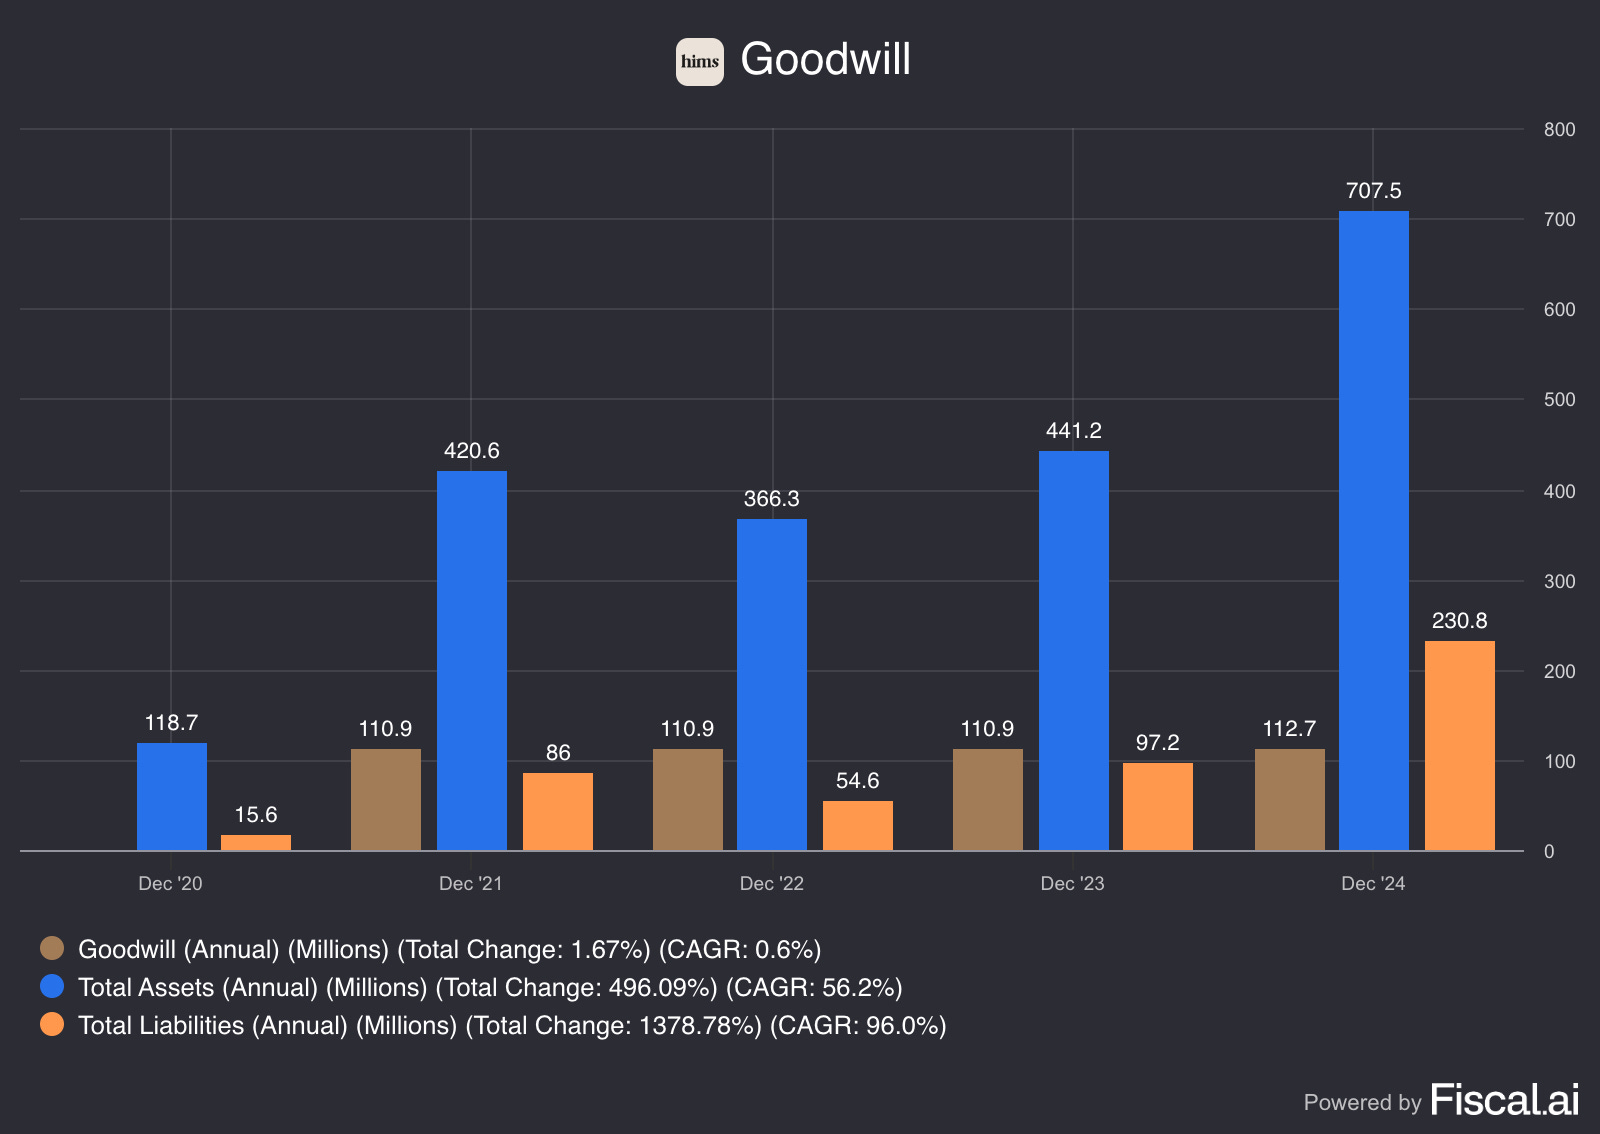
Goodwill
Goodwill demonstrates remarkable financial expansion over the past five years. Total assets surged from $118.7 million in December 2020 to $707.5 million by December 2024, a 496% increase with a compound annual growth rate of 56.2%.
The organization's revenue grew steadily but more modestly, rising from $110.9 million to $112.7 million (1.67% total change, 0.6% CAGR). Meanwhile, total liabilities increased significantly from $15.6 million to $230.8 million, representing a 1,378% jump with a 96% annual growth rate.
This data reveals Goodwill's aggressive asset accumulation strategy, likely through acquisitions or major infrastructure investments, while maintaining relatively stable operational revenue. The dramatic rise in liabilities suggests substantial debt financing to fund this expansion, transforming Goodwill's financial profile from a lean operation to a much larger, more leveraged organization.
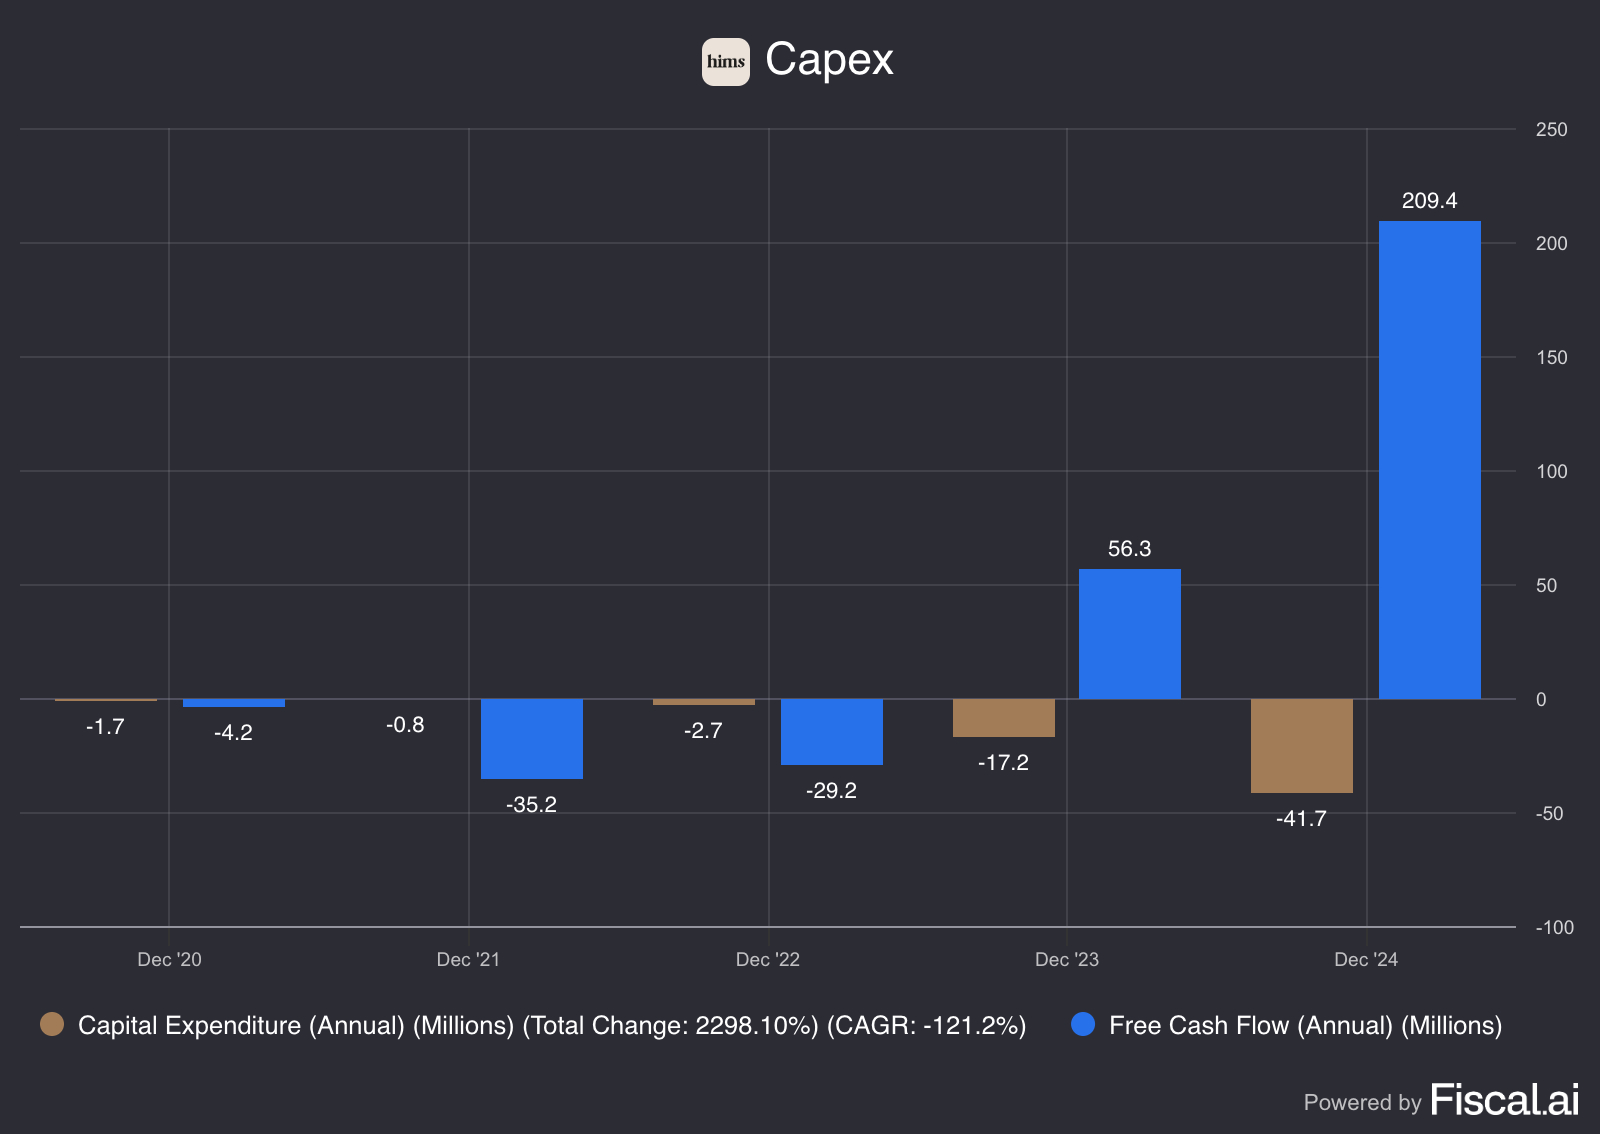
Capex (Maintenance/Growth)
Capex experienced a dramatic financial turnaround from sustained losses to strong profitability. Free cash flow shifted from negative $4.2 million in December 2020 to positive $209.4 million by December 2024, a remarkable recovery trajectory.
The company endured challenging years through 2022, with cash flow hitting bottom at negative $35.2 million in 2021 and negative $29.2 million in 2022. However, 2023 marked the inflection point with positive $56.3 million in free cash flow, followed by explosive growth to $209.4 million in 2024.
Capital expenditure patterns show interesting volatility, ranging from modest negative $17.2 million in 2023 to significant negative $41.7 million in 2024.
This data suggests Capex successfully navigated through operational difficulties and restructuring, ultimately achieving substantial cash generation while maintaining strategic investments in growth.
If you like what you are reading, make sure to SUBSCRIBE so you don’t miss any posts!
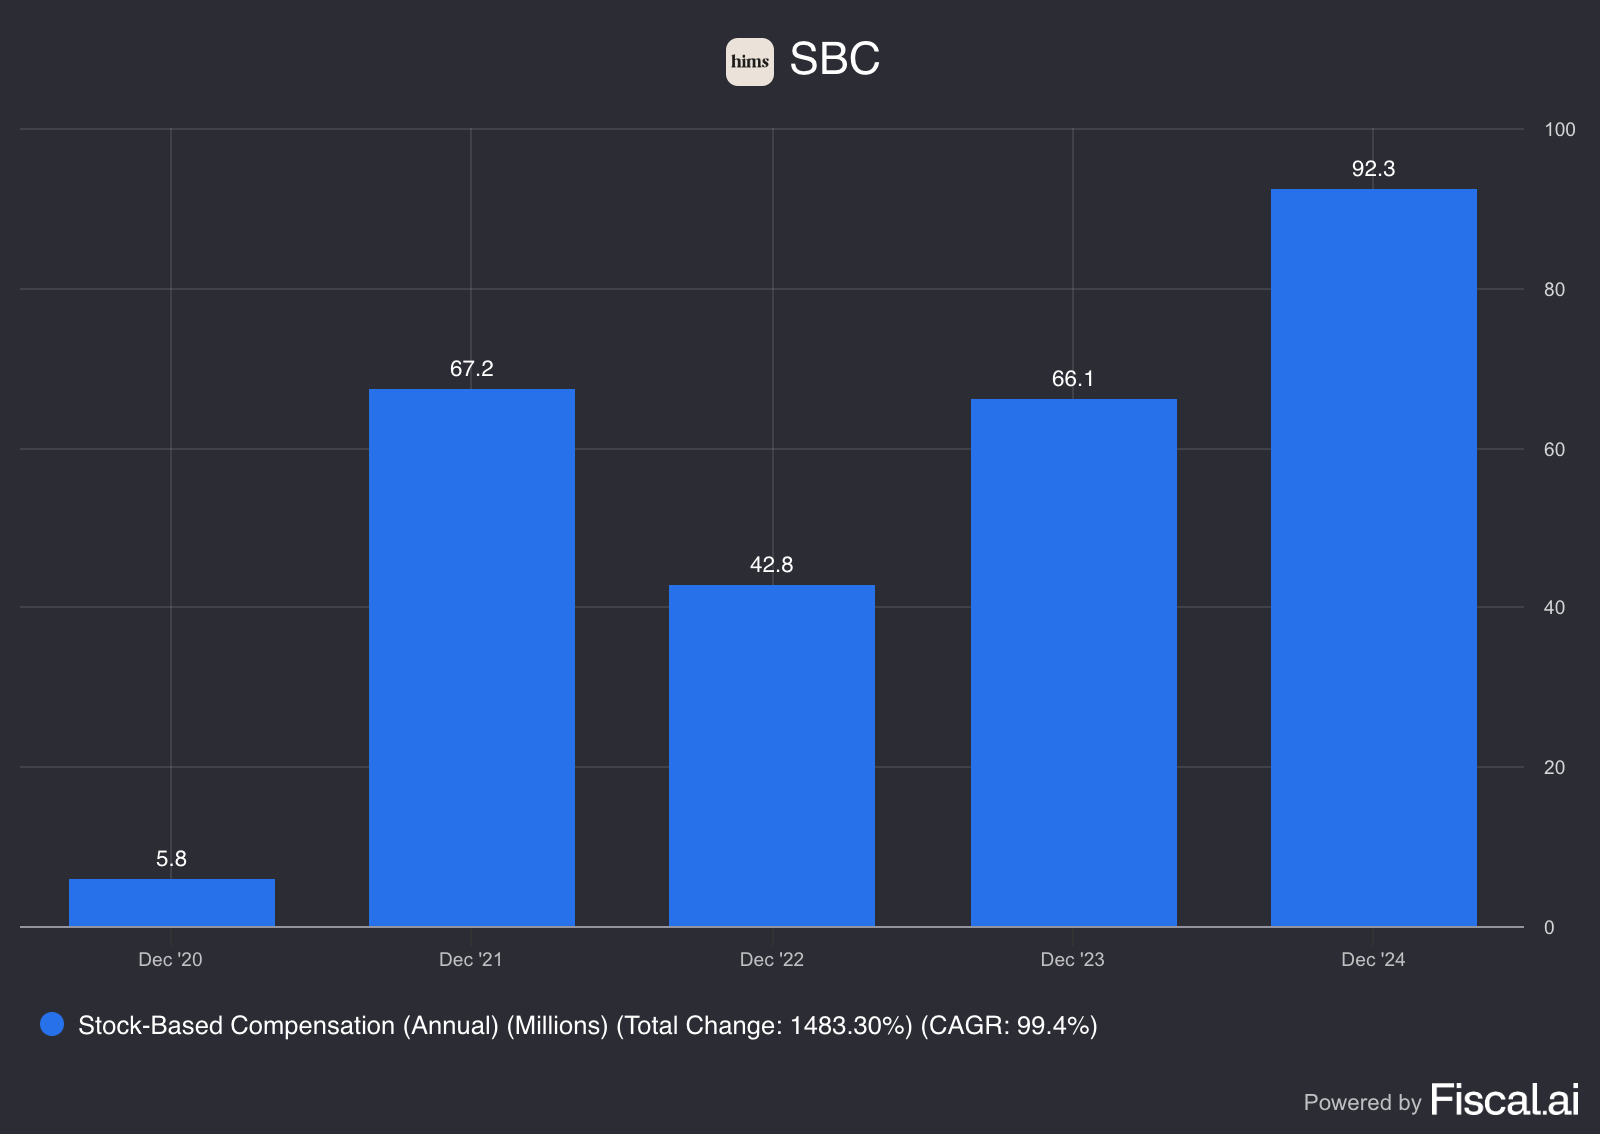
Stock Based Compensation
Stock-Based Compensation (SBC) is a non-cash expense which means that it affects financial statements but does not directly impact Free Cash Flow (FCF).
However, it does have indirect effects on a company’s financial health and valuation.
How SBC Affects Free Cash Flow
SBC is Added Back to Operating Cash Flow (OCF):
Since SBC is a non-cash expense, it is deducted from net income on the Income Statement but added back when calculating Operating Cash Flow under the indirect method of cash flow reporting.
This can make FCF appear higher, even though it does not actually generate cash.
Potential Dilution Impact:
While SBC increases FCF in the short term (since it's a non-cash expense), it leads to more outstanding shares over time, which can dilute earnings per share (EPS) and affect stock value.
Investors should be cautious when high SBC artificially boosts FCF while increasing share dilution.
Adjusted Free Cash Flow (Adj. FCF)
To account for SBC’s impact, some investors use an adjusted FCF metric:
Adjusted FCF = FCF − SBC
This adjustment gives a more conservative view of true cash generation by treating SBC as an actual cost to shareholders.
Let’s now take a look at Hims’ Stock-Based Compensation:
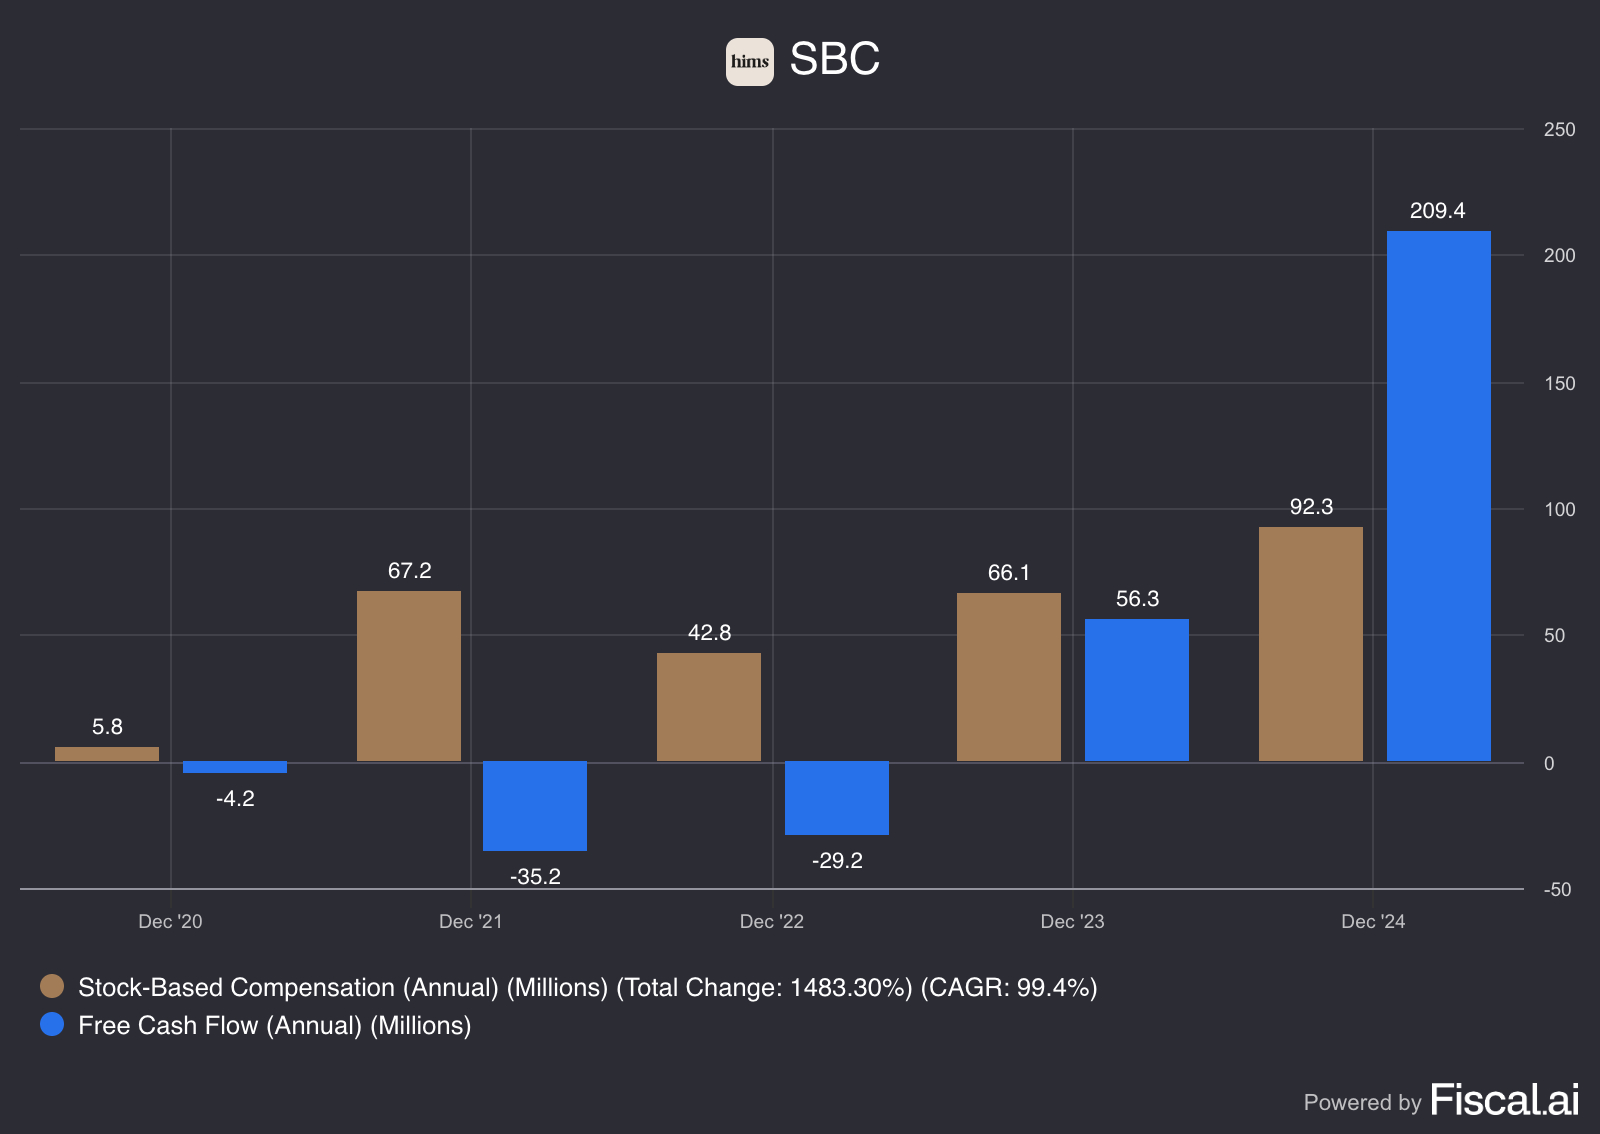
Hims has been issuing Stock-Based Compensation (SBC), which impacts its reported free cash flow in a negative way and basically making free cash flow worthless.
Additionally, the gap between FCF and SBC on the other side seems to be getting better, indicating that SBC’s impact on FCF is gradually decreasing. This is a good sign.
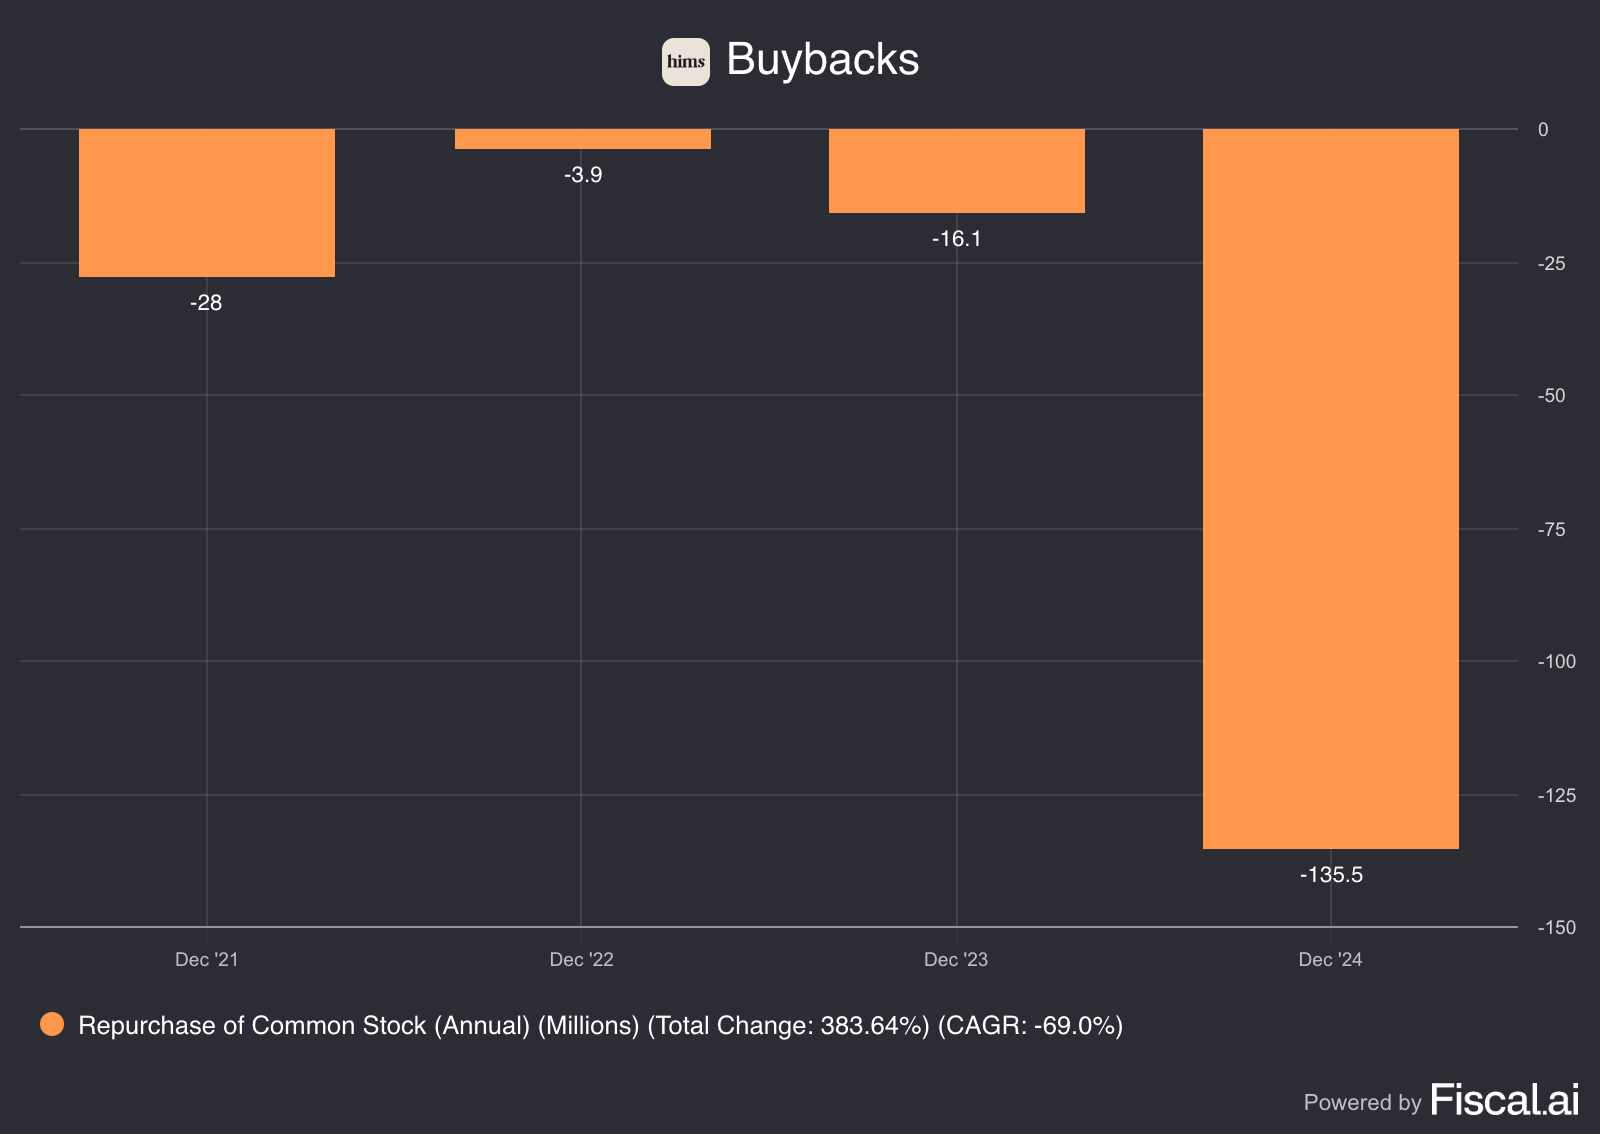
Buybacks
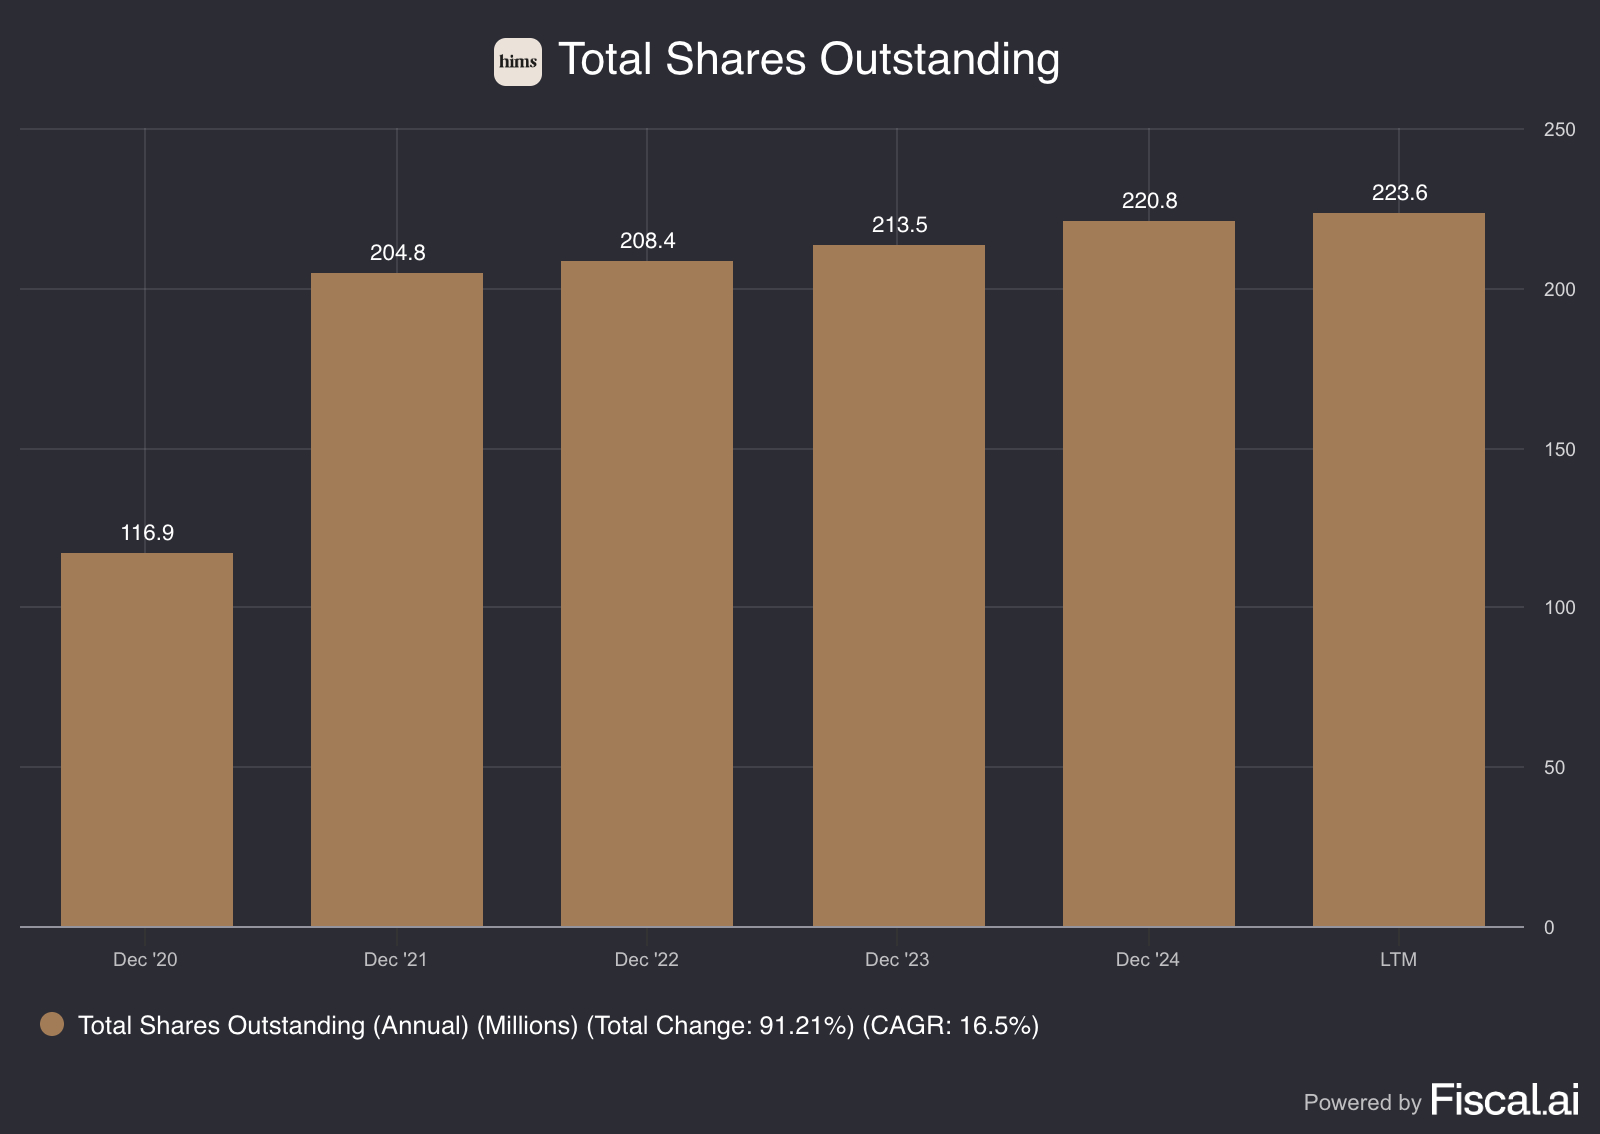
It appears that Hims does repurchase shares, it has been repurchasing shares since 2021. Last year, they bought back around 136 million worth of shares out of a total of 224 million shares.
As an investor, share buybacks are generally seen as a positive sign because they can increase the value of the shares you currently own. They often indicate management’s confidence in the company’s future and can help drive long term shareholder value.
If I’m being honest, I’m not the biggest fan of buybacks. I believe companies could put that money to better use by investing in initiatives that genuinely strengthen the business. Rather than spending cash on buybacks, they could focus on areas that drive long term growth and create real value. But hey, I’m just a simple investor, what do I know?
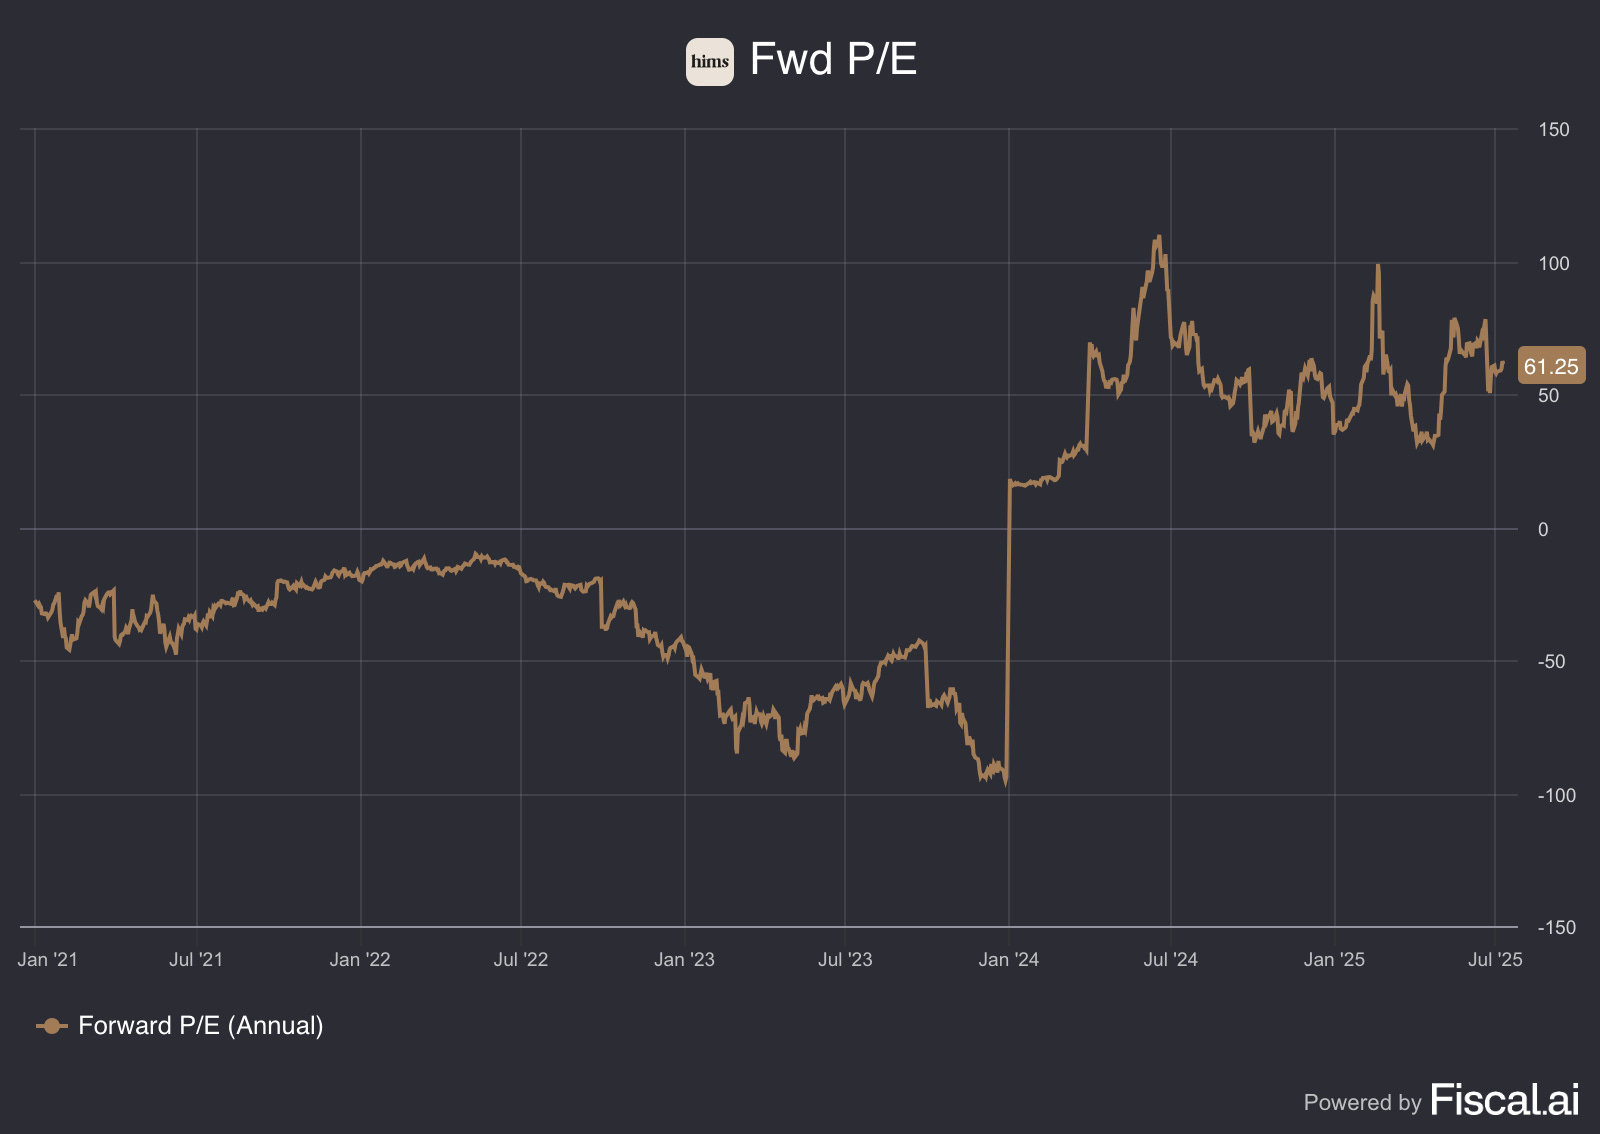
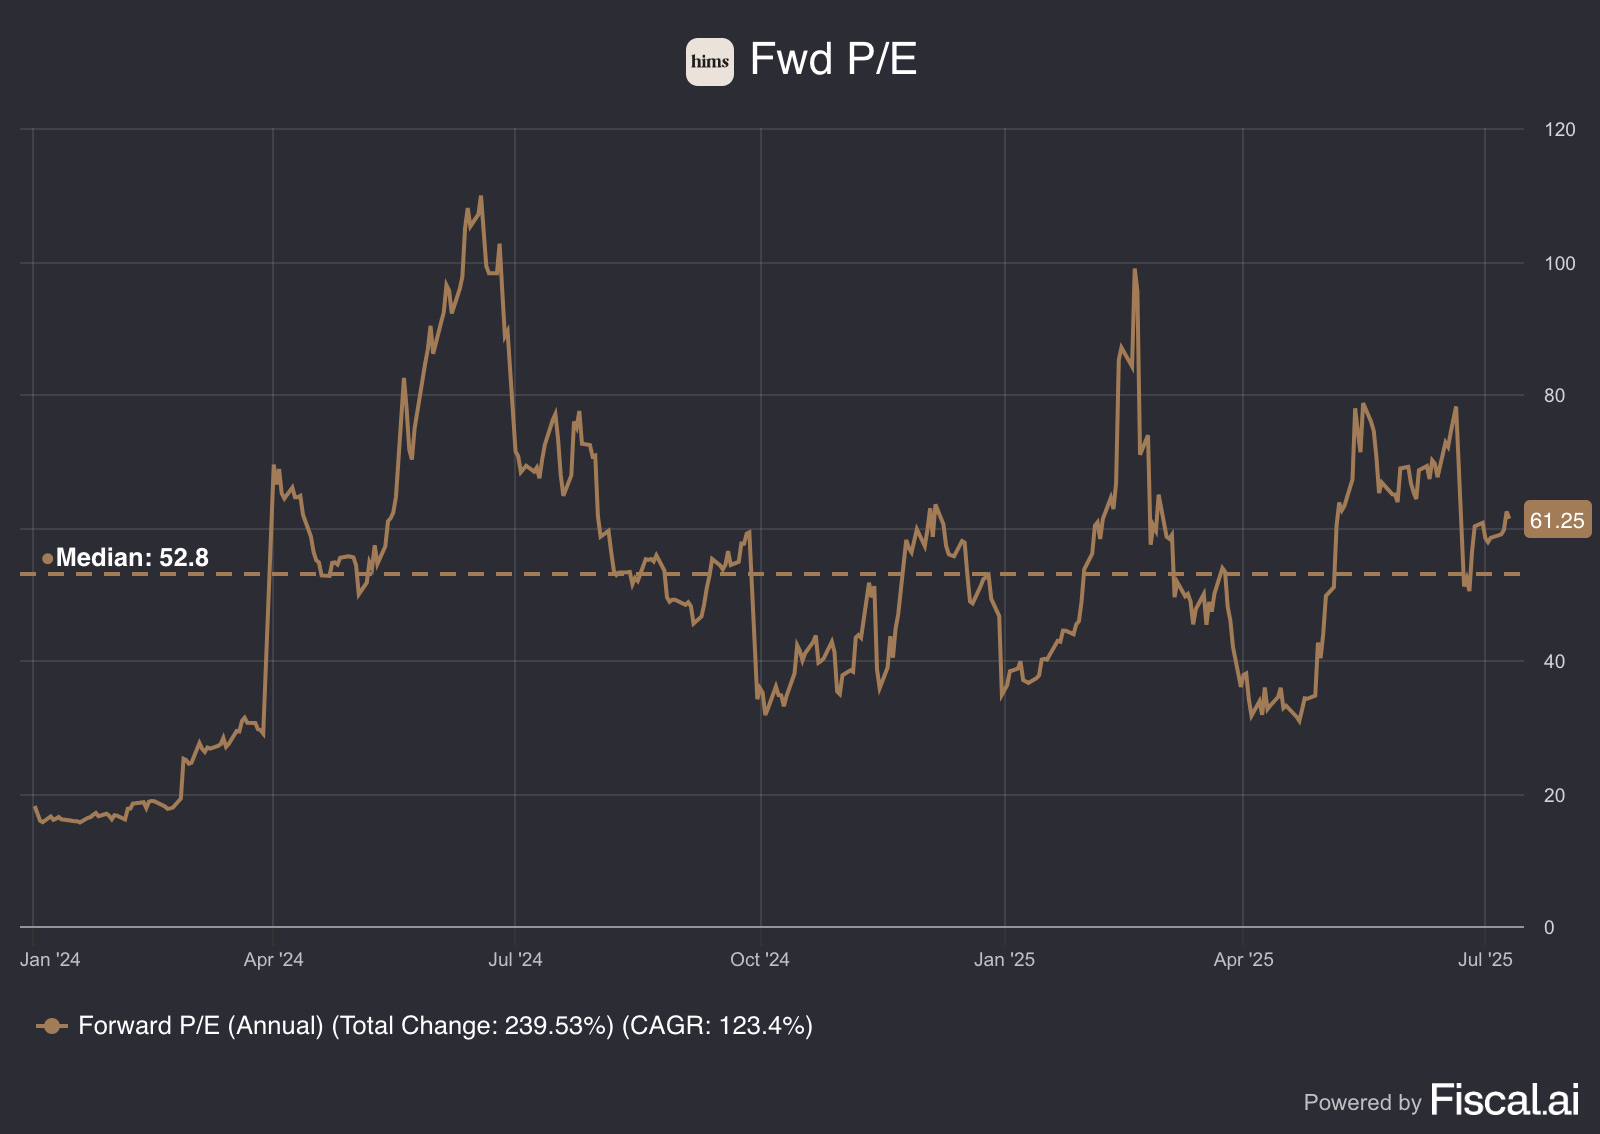
Forward P/E
The forward P/E ratio tells a story of extreme market volatility and valuation swings. Starting around -30 in early 2021, the ratio gradually improved through mid-2021 before peaking near -10 in early 2022.
A dramatic downturn followed, with the forward P/E plummeting to approximately -90 by late 2022, indicating either negative earnings expectations or severe market pessimism. The recovery began in mid-2023, with the ratio climbing sharply from -90 to over 100 by early 2024 - representing one of the most dramatic valuation reversals in the dataset.
The period from early 2024 through mid-2025 shows continued volatility, with the forward P/E fluctuating between 50-100 before settling at 61.25 by July 2025. This final reading suggests the market expects moderate earnings growth, though the ratio remains elevated compared to typical market averages.
The wild swings from deeply negative to triple-digit positive values indicate either a company transitioning from losses to profitability or significant market uncertainty about future earnings potential.
When I look at the Forward P/E, I always compare it to the stock’s historical median to get a sense of whether it’s undervalued or overvalued. But it’s also key to remember that this ratio is based on earnings, so if earnings are going down, the multiple can be pretty misleading. A low P/E might look attractive, but it doesn’t mean much if the business is struggling underneath.
Hims’ forward P/E is trading well above its historical median, suggesting the stock may currently be overvalued based on this metric.
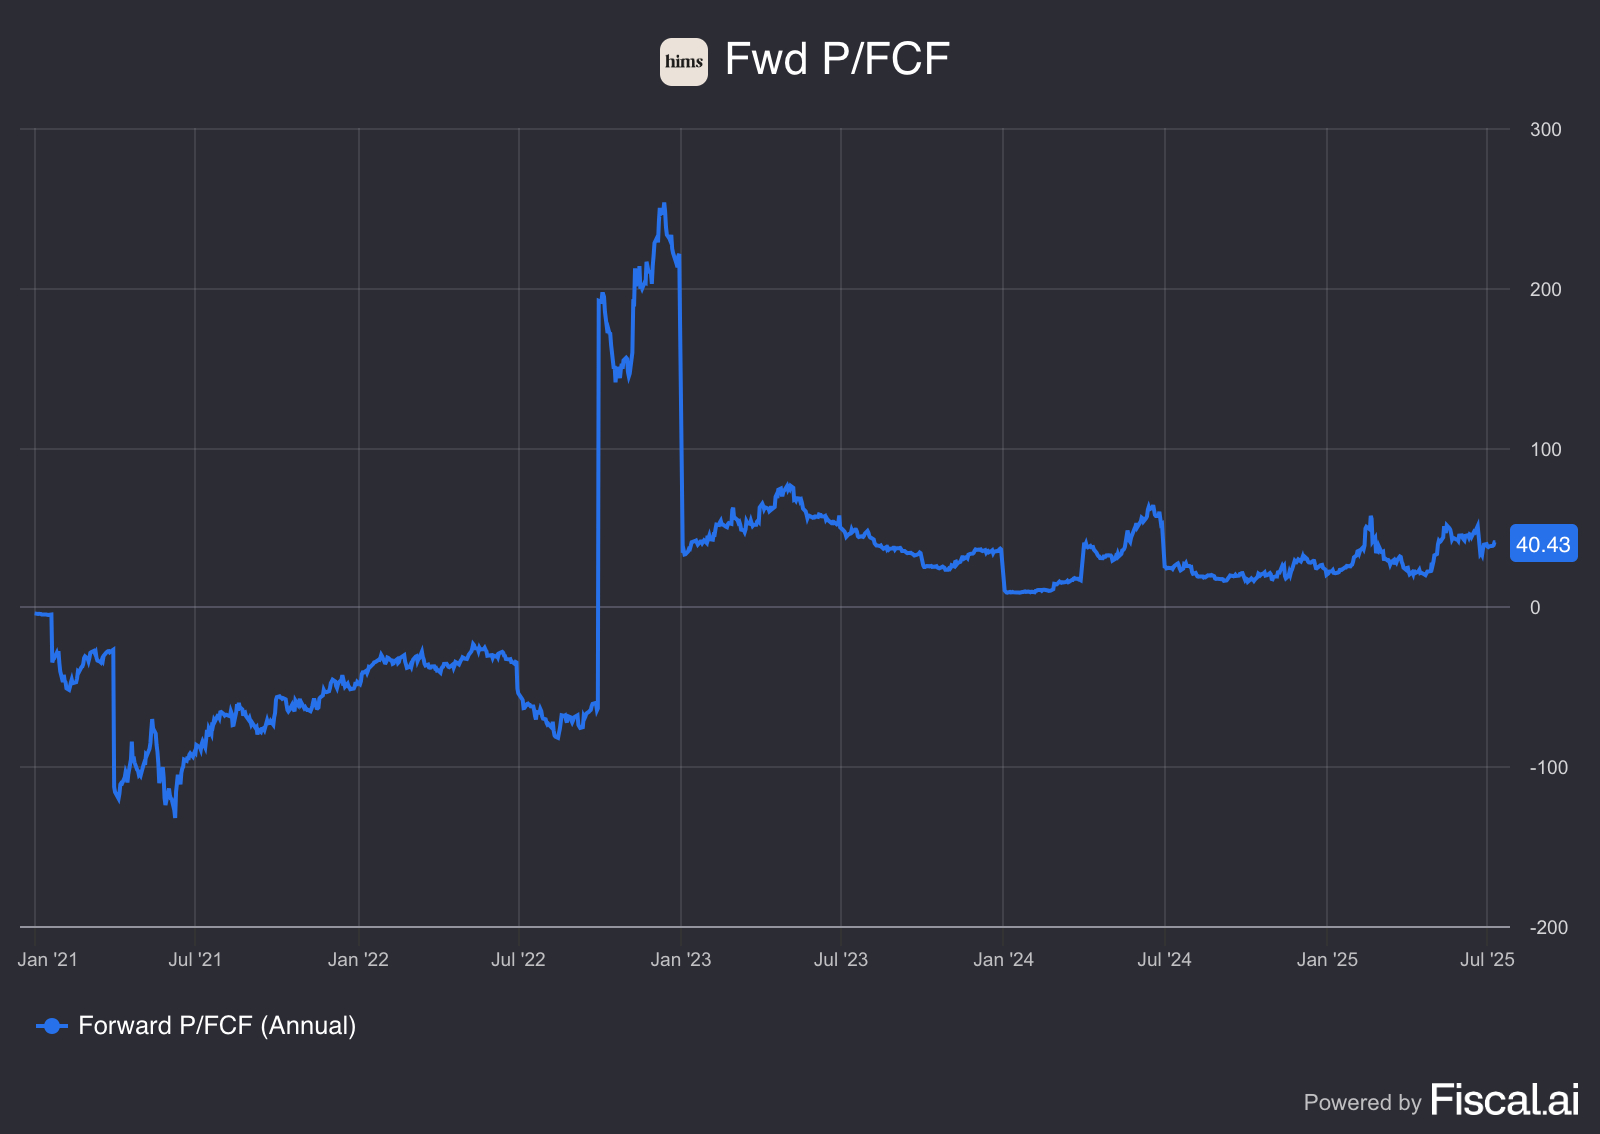
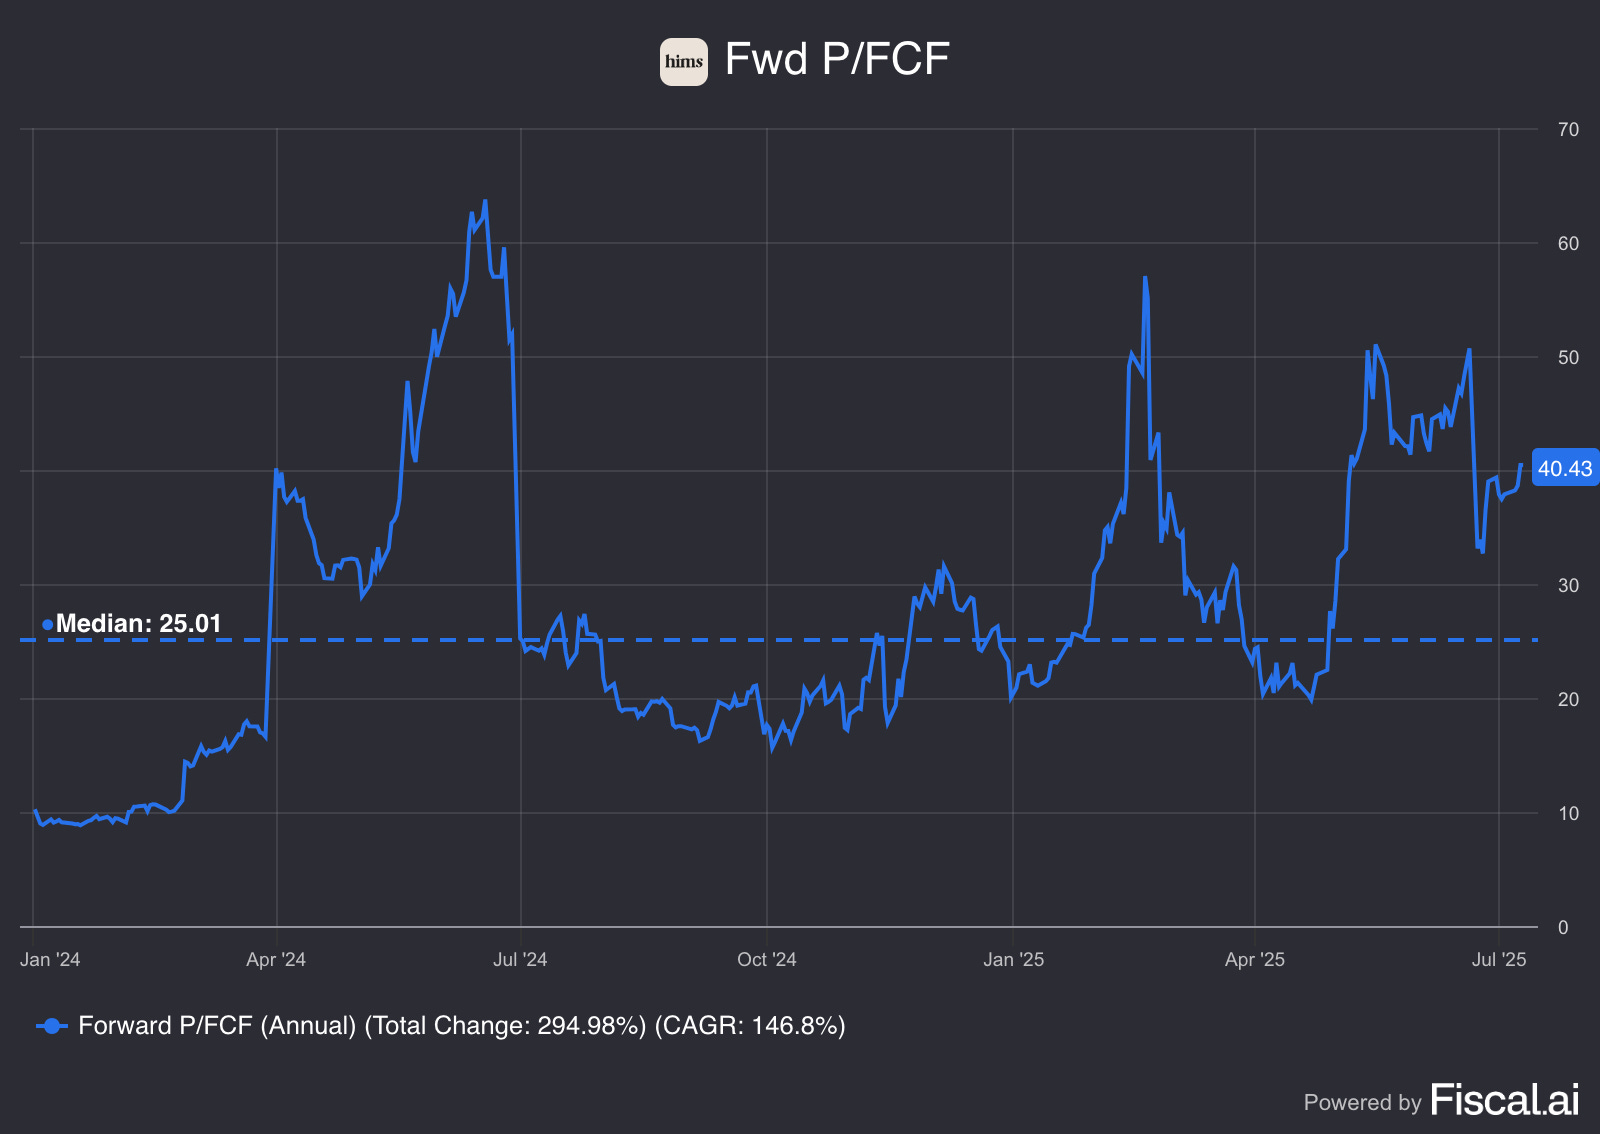
Forward P/FCF
The forward P/FCF ratio reveals extreme valuation turbulence across four and a half years. Beginning 2021 with significant volatility around -20 to -120, the ratio gradually stabilized and climbed through mid-2022, reaching approximately -20.
The most dramatic event occurred in late 2022, when the forward P/FCF ratio spiked to an extraordinary peak of nearly 250, suggesting either massive cash flow expectations or severe market dislocation. This spike was short-lived, with the ratio crashing back to around 50 by early 2023.
From 2023 onward, the metric shows relative stability, fluctuating between 20-80 with occasional spikes to 70-80 in mid-2024. The ratio has settled at 40.43 by July 2025, indicating the market expects the company to generate approximately $40 in market value for every dollar of forward free cash flow.
The dramatic 2022 spike followed by stabilization suggests the company successfully navigated a major transition period, likely moving from negative to positive free cash flow expectations while achieving more predictable cash generation patterns.
When I look at the Forward P/FCF, I always compare it to the stock’s historical median to get a sense of whether it’s undervalued or overvalued. But it’s also key to remember that this ratio is based on free cash flows, so if free cash flows are going down, the multiple can be pretty misleading. A low P/FCF might look attractive, but it doesn’t mean much if the business is struggling underneath.
Hims’ forward P/FCF is trading well above its historical median, suggesting the stock may currently be overvalued based on this metric.
If you like what you are reading, make sure to SUBSCRIBE so you don’t miss any posts!
Earnings Growth Model
This model tells us the yearly expected return based on the growth of the earnings and shareholder yield.
The formula looks like the following:
Expected return = EPS growth + dividend yield +/- multiple expansion (contraction)Here are the assumptions I use:
EPS Growth = 37% per year over the next 10 years (my own estimate based on the latest yoy EPS growth)
Dividend Yield = / (there is no dividend)
Forward PE to decrease from 61x (current) to 53x (median) over the next 10 years
Expected return = 37% + 0 + 0.1*((53-61)/61))= 35.69%So, this means that we should be happy with a return of 35.69% per year.
In case of a more conservative EPS growth: a 30% EPS growth, we get the following:
Expected return = 30% + 0 + 0.1*((53-61)/61))= 28.69%With an estimated 30% EPS growth, we should expect a 28.69% return per year.
Reverse DCF
A reverse DCF is very easy to execute.
When looking at this model, you only need to know 3 main things:
The current stock price of the company
The number of shares outstanding
The Free Cash Flow in Year 1
Next to the following three things, you also need the following:
Perpetuity Growth rate: growth rate after year 10
Use 3% ( this the average growth of the global economy)
Discount rate: The % used to discount future cash flows to today, accounting for risk and time
Discount rate = a proxy for our expected return
20% (the expected return, it’s important to notice that if you adjust this the impact will be huge on the model) (for a growth stock I expect at least a 20% return per year)
With a discount rate of 20%, you can expect a yearly return of 20% as an investor
Let’s use this model for Hims.
Hims
Let’s look into a Reverse DCF for Hims.
We need to know three things:
The current stock price of the company
The number of shares outstanding
The Free Cash Flow in Year 1
The current stock price as of the 5th of July is:
$50.15
The number of shares outstanding are:
224 million
The Free Cash Flow in Year 1
$263 million (expected FCF for 2025)
Two adjustments need to be made to Hims’ FCF:
Subtract Stock-Based Compensation (cost for shareholders)
Add Growth CAPEX
Stock-Based Compensation
Stock-based compensation is a cost for shareholders.
As a result, we subtract it from Hims’ FCF.
Hims’ Stock-Based Compensation = $92 million
Adding Growth Capex
A distinction can be made between Maintenance Capex and Growth Capex:
Maintenance Capex: Investments made in existing assets
Growth Capex: Investments made in new assets in order to grow
When a company invests a lot in future growth, its growth capex is very high but these investments should create a lot of value in the long term.
As a rule of thumb, we state that the company’s maintenance capex equals Depreciation & Amortiziation.
Capex = Maintenance Capex + Growth Capex
Maintenance Capex = Depreciation & Amortiziation
Growth Capex = Total Capex - Depreciation & Amortiziation
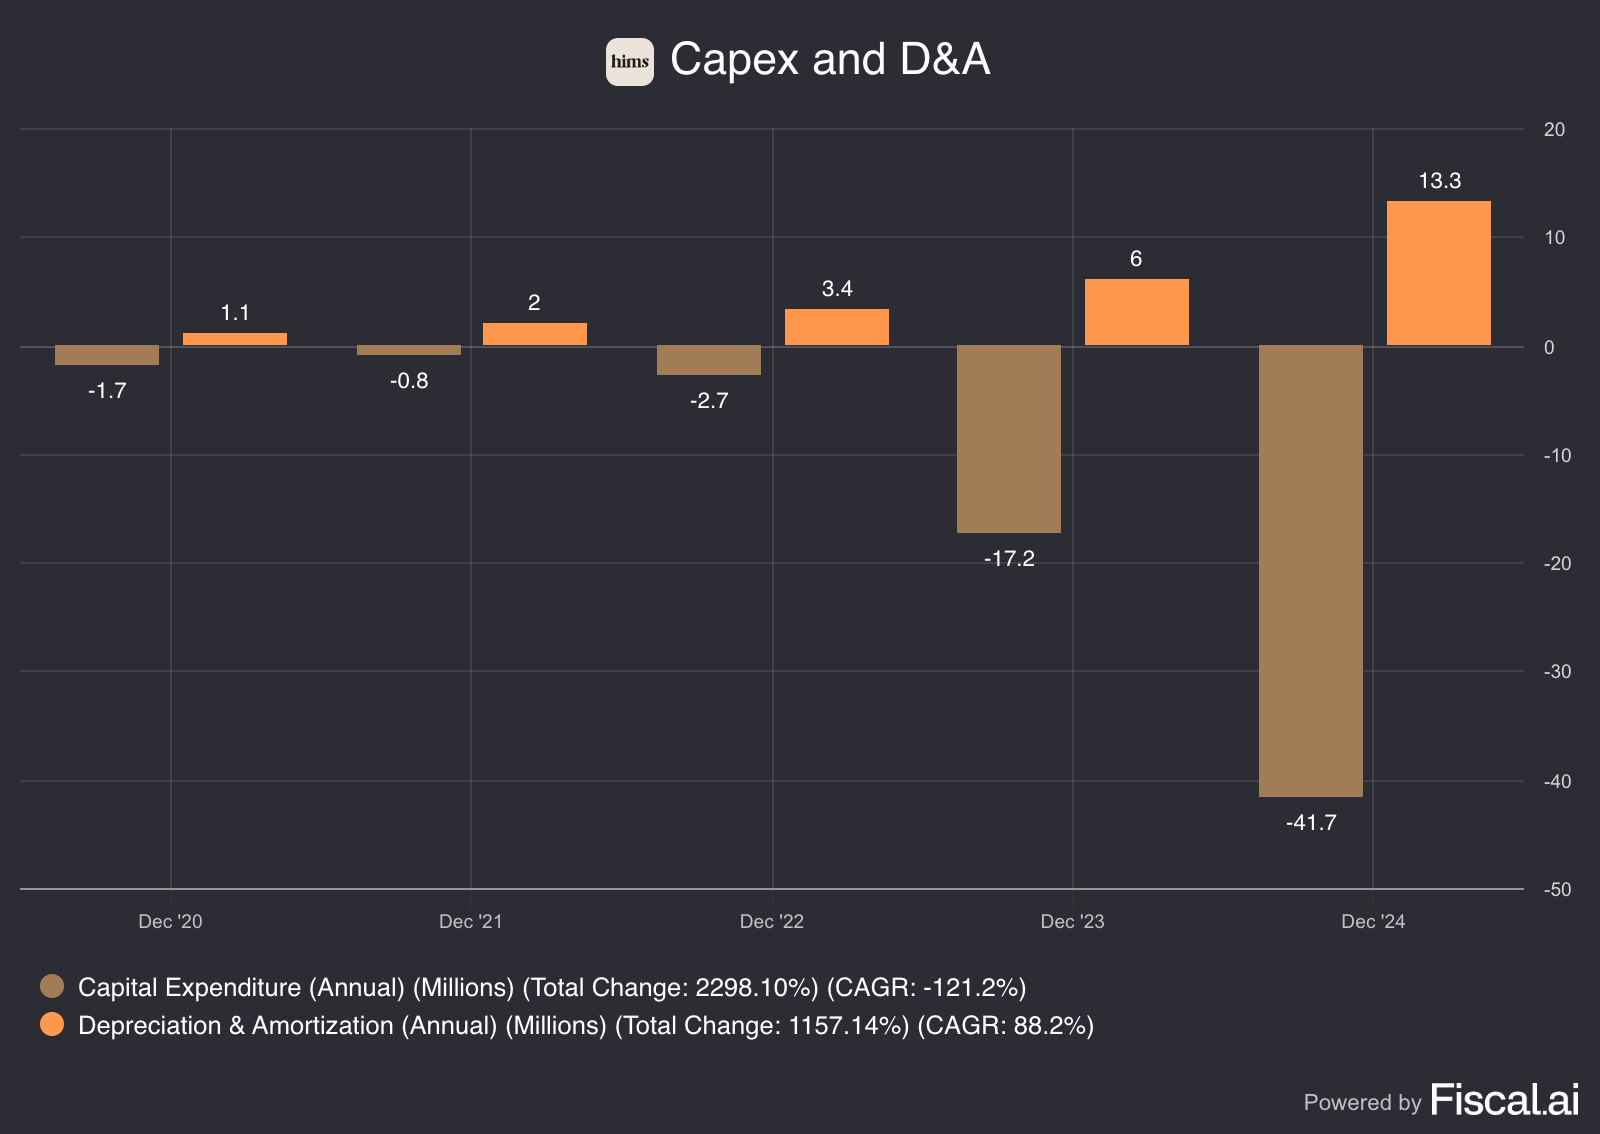
Capex = $42 million
Depreciation & Amortization = $13 million
Now that we have the following numbers, we can calculate the Growth Capex:
Growth Capex = Total Capex - Depreciation & Amortization
Growth Capex = $42 million - $13 million
Growth Capex = $29 million
As we know the Free Cash Flow, Stock-Based Compensation and Growth CAPEX, we can now calculate the adjusted Free Cash Flow we use in our model:
Adjusted FCF = FCF - SBC + Growth Capex
Adjusted FCF = $263 million - $92 million + $29 million
Adjusted FCF = $200 million
Excel Spreadsheet
Now we go to our Excel spreadsheet and fill in all the information.
Our input looks as follows:

The only thing we still need to do is click the ‘Calculate Growth Rate’ button.
After you click it, you get the following:

But, what does this mean?
Look at the growth rate (year 1-10).
This number shows you how much Hims’ FCF should grow in the next 10 years to generate a return of 20% per year for you as a shareholder.
Hims needs to grow its FCF by 47,11% per year to generate an annualised return of 20%.
Is this realistic?
Let’s look at two things:
The historical FCF Growth of Hims
Analysts’ expectations
Historical FCF Growth
The evolution of Hims’ FCF looks as follows:

As you can see in the chart above, Hims has quite a steady Free Cash Flow growth. But, the FCF has increased dramatically over the last few years meaning that the growth rate to compare it with is a not so realistic. And that’s why, I’m gonna use a conservative approach here and go for a 40% FCF growth, as a historical reference point.
Analysts’ expectations
Now, we are going to look into what analysts expect from Hims in the years ahead.
EPS isn’t the same as FCF, but we use it as a proxy because FCF estimates aren’t available.
As you can see below, analysts expect Hims to grow its FCF (/EPS) by 37% per year.

Is Hims overvalued or undervalued?
Now, let’s determine whether Hims is overvalued or undervalued.
Expectations implied in the current stock price (Reverse DCF): 55,43%
→ Hims should grow its FCF by 47,11% per year to generate a return of 20% per year for you as an investor.
Is this realistic?
→ Analysts expect Hims to grow its FCF by 37% per year in the years ahead.
The numbers suggest that Hims is slightly overvalued at its current price. Considering the full picture, I would rate Hims as a Hold for the simple fact that the reverse DCF model shows that it’s overvalued and the fact that the stock has already ran quite a bit, the risk/reward on Hims doesn’t look that appealling to me anymore.
But let me be clear with you:
If you believe Hims can grow its FCF per year at just half the pace it already did, from $56 million to $209 million in under two years, you're still looking at a company with serious upside.
That jump represents a 273% increase.
Even half of that, around 136%, would still fundamentally reprice this business.
Which means one thing:
The market hasn’t caught up on Hims, yet.
2. Technical Analysis
In this second section, I’ll cover a short Technical Analysis on Hims.

As shown in the chart, Hims’ price is currently trading at around $47.89. I’ve identified a potential BUY zone between $28.50 and $23.80.
(So, right now this doesn’t look appealing to Buy. I would prefer to buy them back at previous levels.)
If you enjoyed reading this breakdown article, you might enjoy these other breakdowns to:


Thank you for reading this article! If you enjoyed reading it, make sure to SUBSCRIBE so you don’t miss out any posts! And share, leave a comment!
Disclaimer: Here