


Fundamentals meet Technicals: Robinhood
A Fundamental and Technical Analysis.


So, today we’ll discuss whether Robinhood seems like a stock to keep an eye on or not.
Overview
Today, I’ll cover the following of Robinhood:
Fundamental Analysis
Technical Analysis
This is also the framework that I’ll be using when doing a Deep Dive into any company that might be ready to BUY.
If you’re interested in seeing more of these Deep Dives where I discuss a companies Fundamentals and Technicals, make sure to SUBSCRIBE so you don’t miss any FREE insights!
1. Fundamental Analysis
In the next section, I’ll discuss the following things:
General Overview (Total Revenues, Net Income, EBIT, Free Cash Flow)
KPI’s
Skin in the game
Gross Profit and Net Income Margin
ROIC
Goodwill
Capex (Maintenance/Growth)
Stock-Based Compensation
Buybacks
Forward P/E
Forward P/FCF
Earnings Growth Model
Reverse DCF
General Overview
In this first part, I’ll discuss the overall fundamentals of the business: Total Revenues, Net Income, EBIT, Free Cash Flow.
Total Revenues
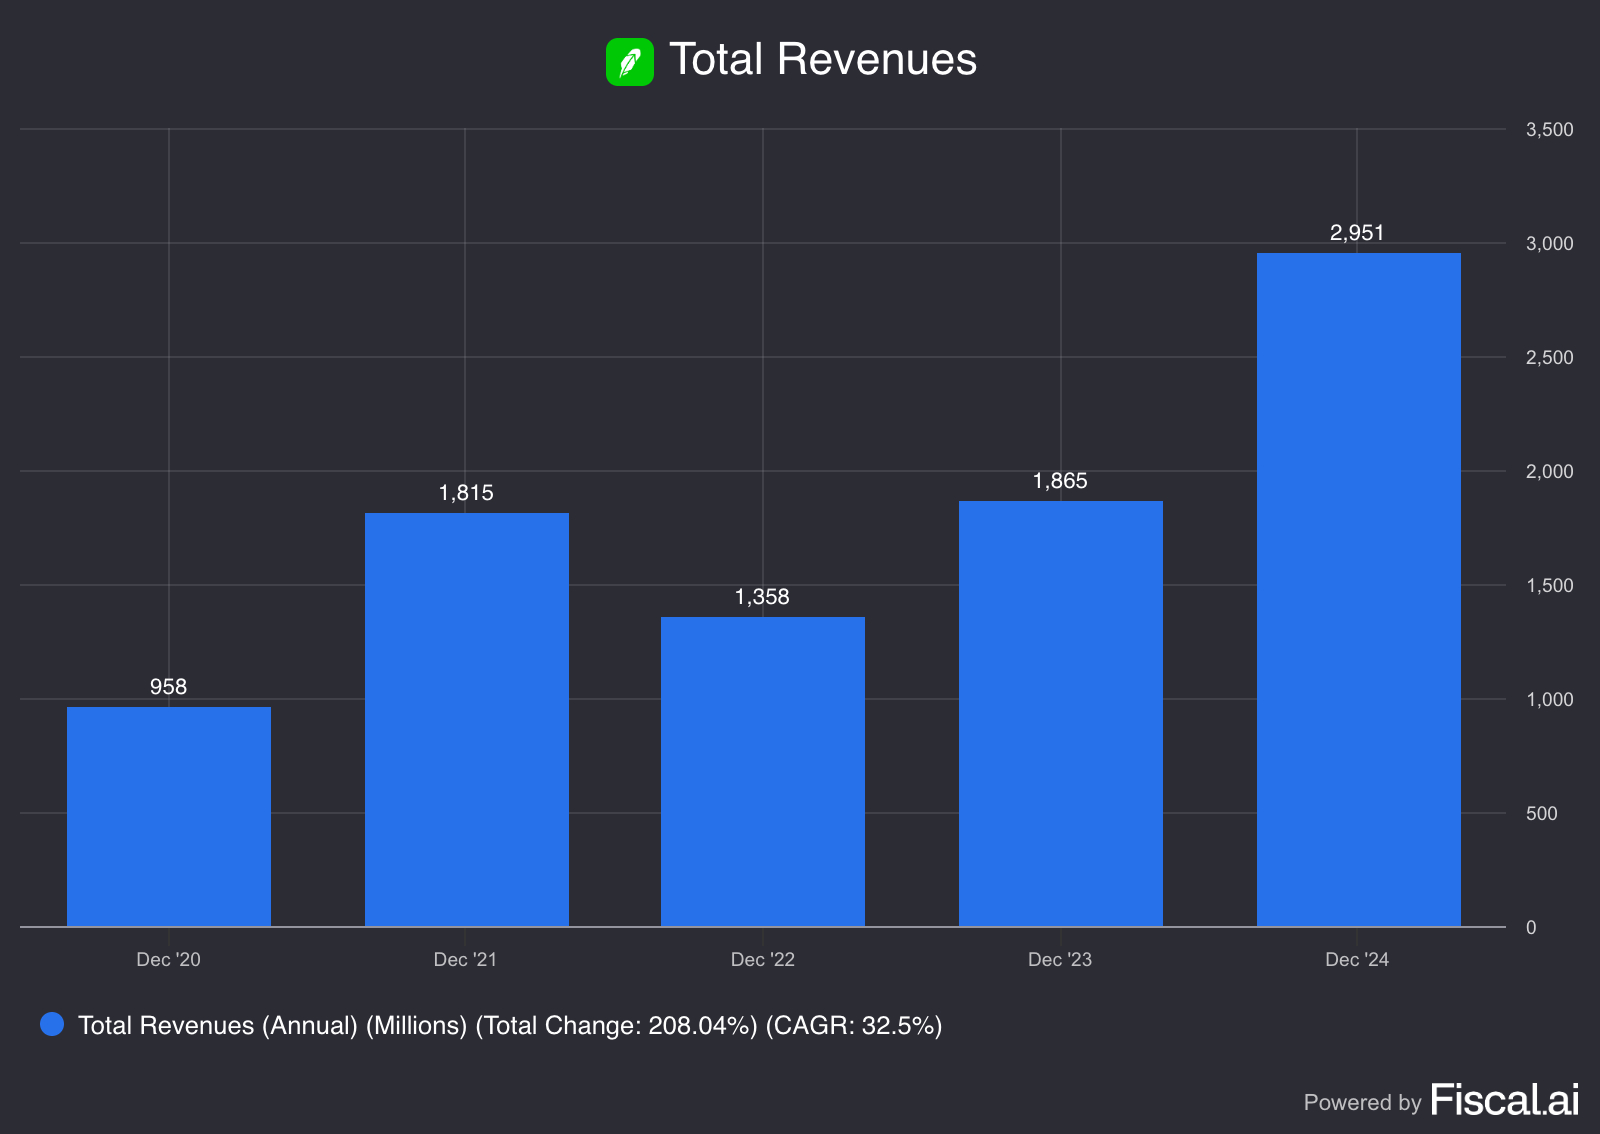
Robinhood's revenue performance from 2020 to 2024 demonstrates a strong growth trajectory with some volatility. The trading platform started with $958 million in revenue in 2020, nearly doubled to $1.8 billion in 2021 during the meme stock trading boom, then pulled back to $1.4 billion in 2022 as market conditions normalized and trading activity declined.
The company rebounded in 2023 with $1.9 billion in revenue and achieved a breakthrough year in 2024, reaching nearly $3 billion. This represents a 208% total increase over the four year period, translating to an impressive 32.5% compound annual growth rate. The growth pattern reflects Robinhood's evolution from a pandemic era trading phenomenon to a more diversified financial services platform, successfully navigating market volatility while expanding its user base and revenue streams.
(In the upcoming segment, I’ll dive deeper into all the different parts of their total revenue.)
Net Income
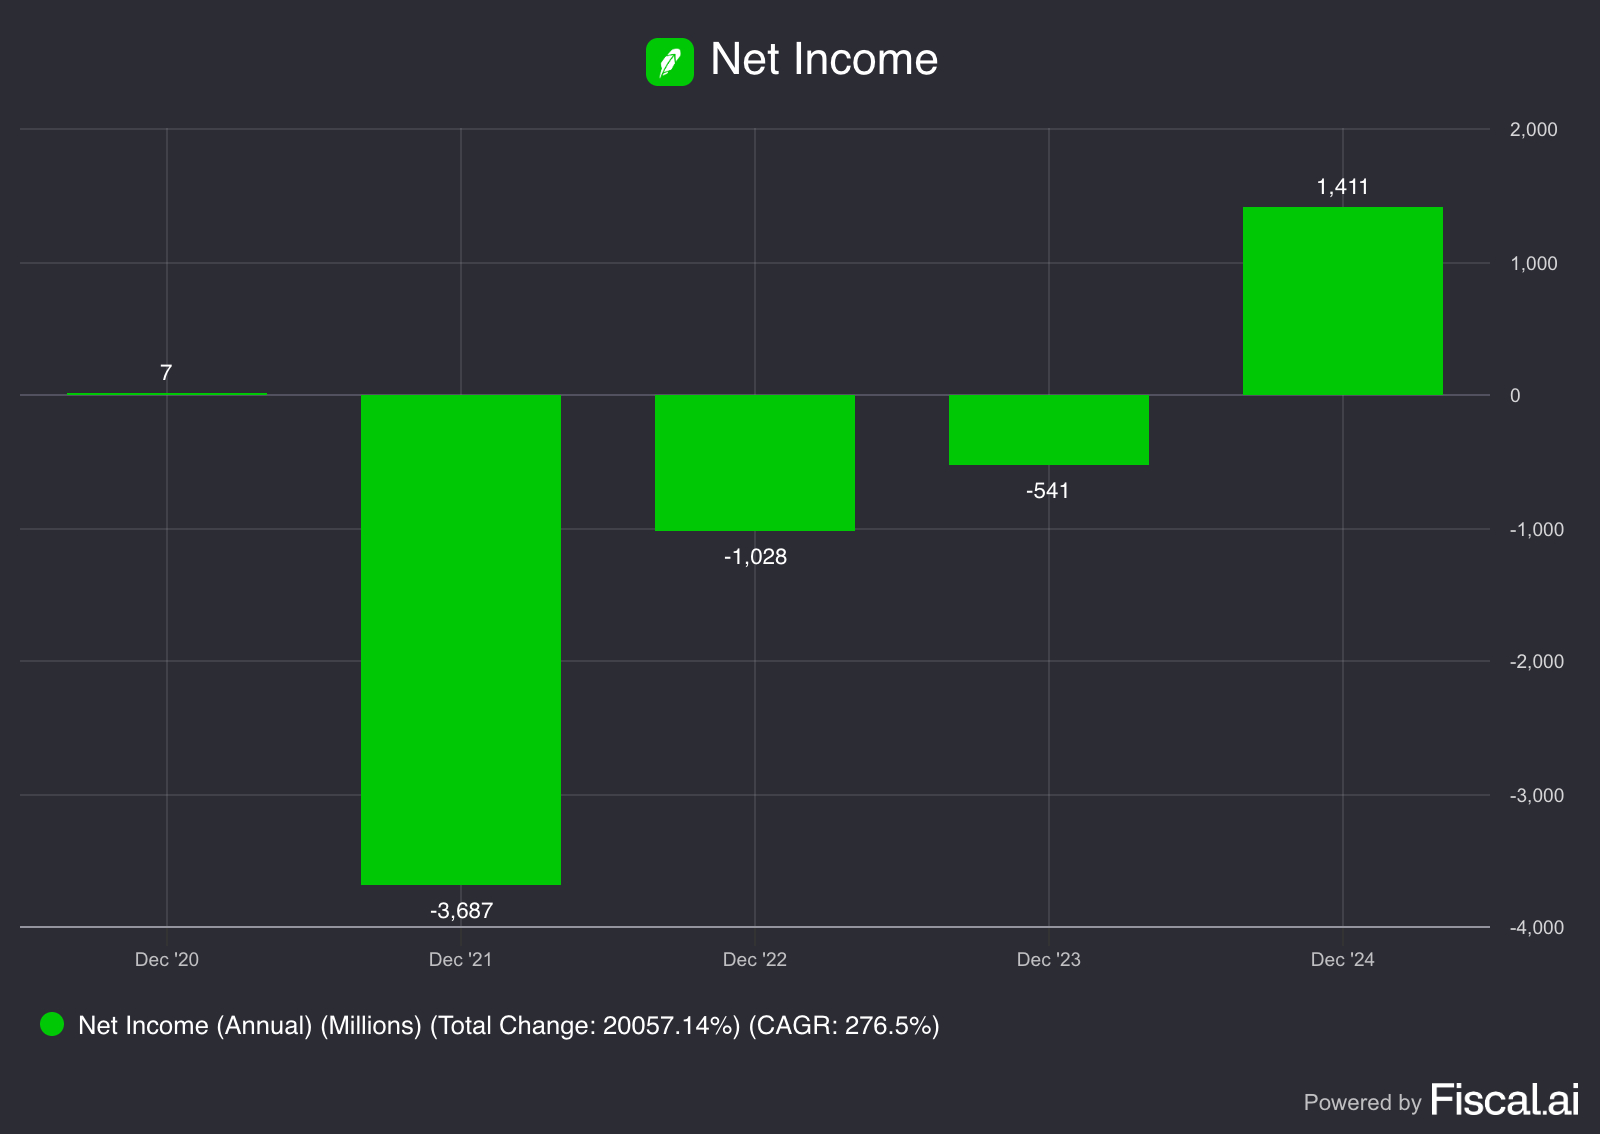
Robinhood's net income tells a dramatic story of financial transformation from 2020 to 2024. The company started with minimal profit of $7 million in 2020, then plunged into significant losses during its growth phase, recording a massive $3.7 billion loss in 2021 followed by a $1.0 billion loss in 2022.
The turnaround began in 2023 with losses narrowing to $541 million, demonstrating improved operational efficiency. The company achieved a remarkable breakthrough in 2024, swinging to profitability with $1.4 billion in net income, a stunning reversal from years of losses.
This reflects Robinhood's journey from a cash burning startup scaling rapidly during the pandemic trading boom to a mature, profitable financial services company, successfully transitioning to sustainable operations.
EBIT or Operating Income
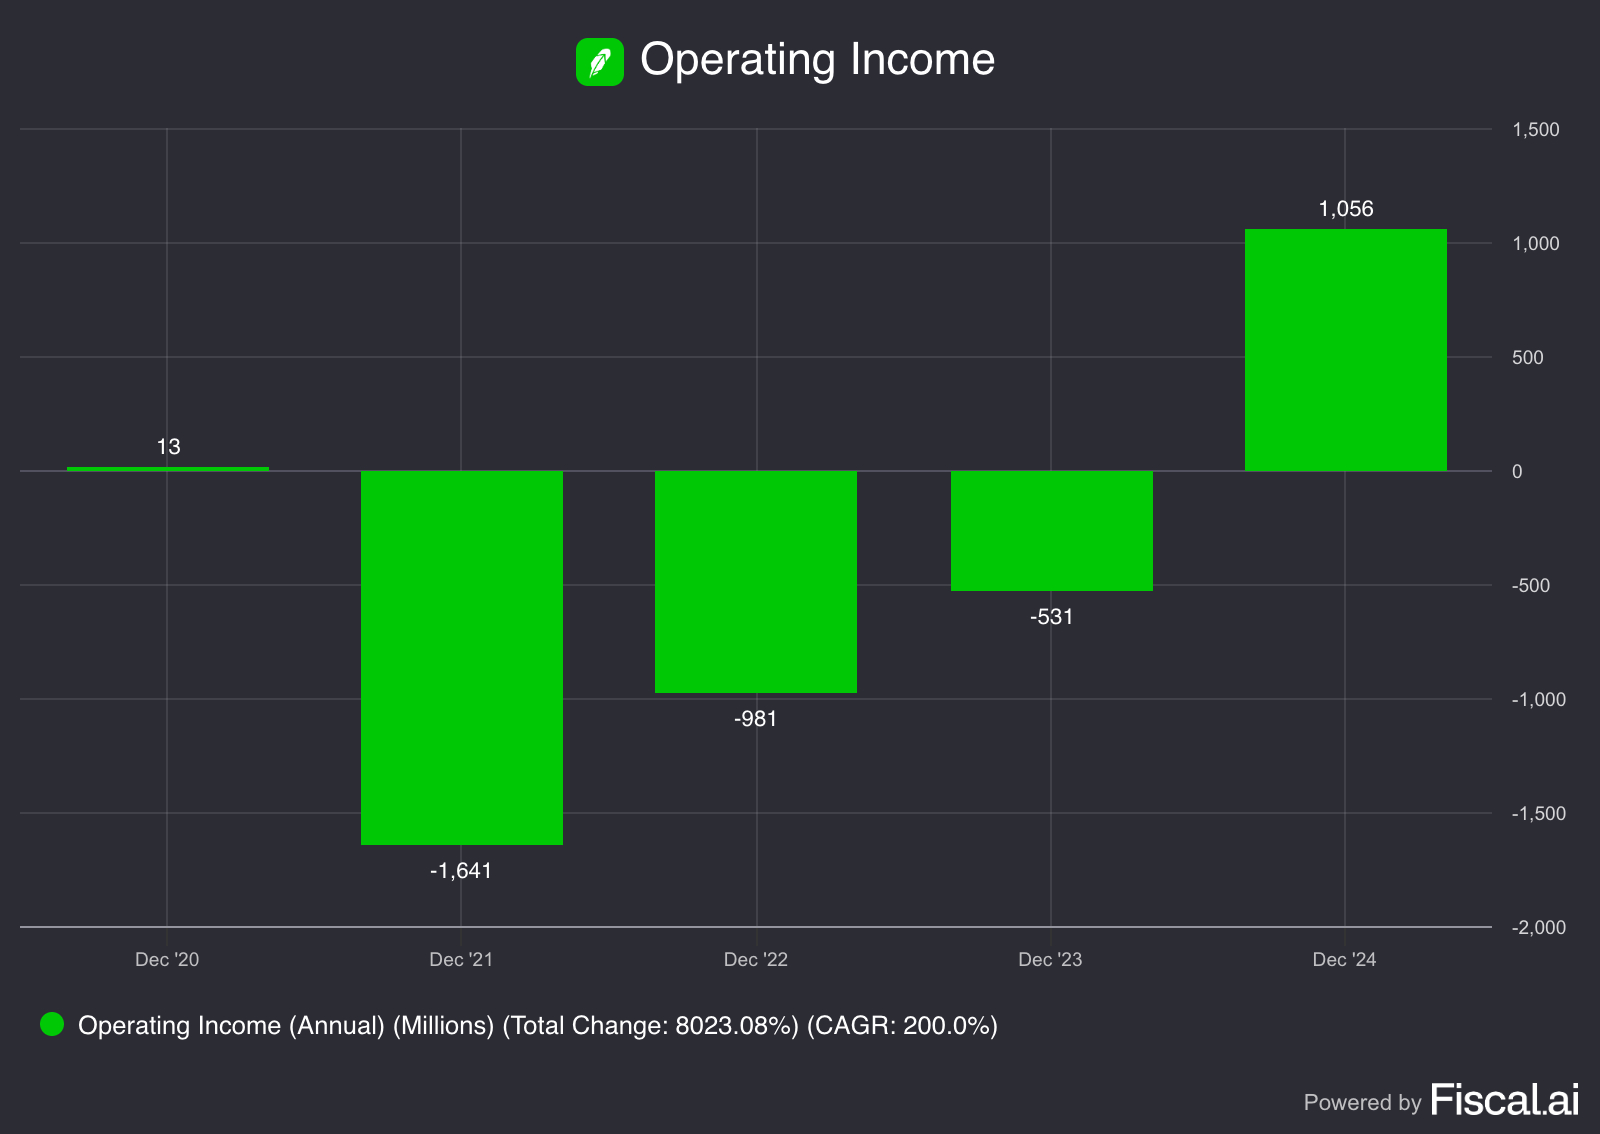
Their operating income demonstrates a clear path from operational losses to profitability from 2020 to 2024. The company started with modest operating income of $13 million in 2020, then faced significant operational challenges with a $1.6 billion loss in 2021 during rapid expansion and heavy investment phases.
Operating losses continued but began improving, with a $981 million loss in 2022 and a smaller $531 million loss in 2023 as the company streamlined operations and controlled costs. The transformation culminated in 2024 with strong operating income of $1.1 billion, marking Robinhood's successful transition to operational profitability.
This progression illustrates how Robinhood evolved from burning cash on operations during its high growth phase to achieving sustainable operational efficiency, demonstrating the company's ability to generate profits from its core business activities.
Free Cash Flow
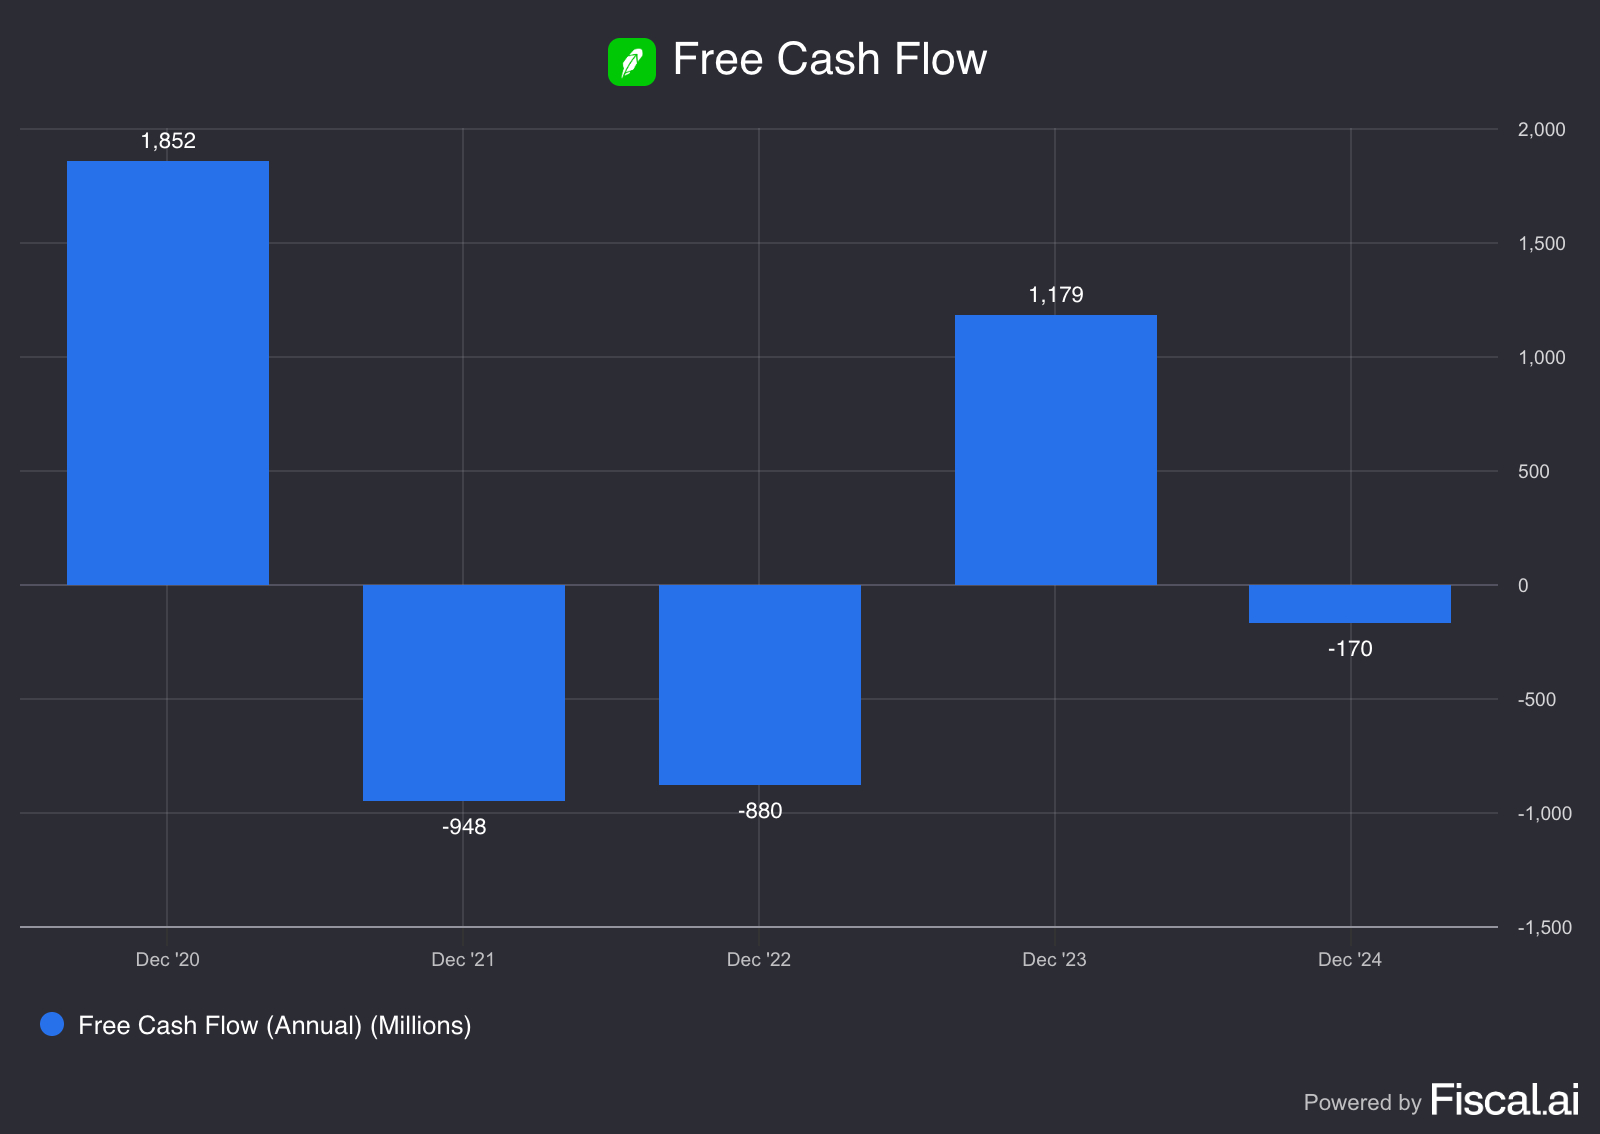
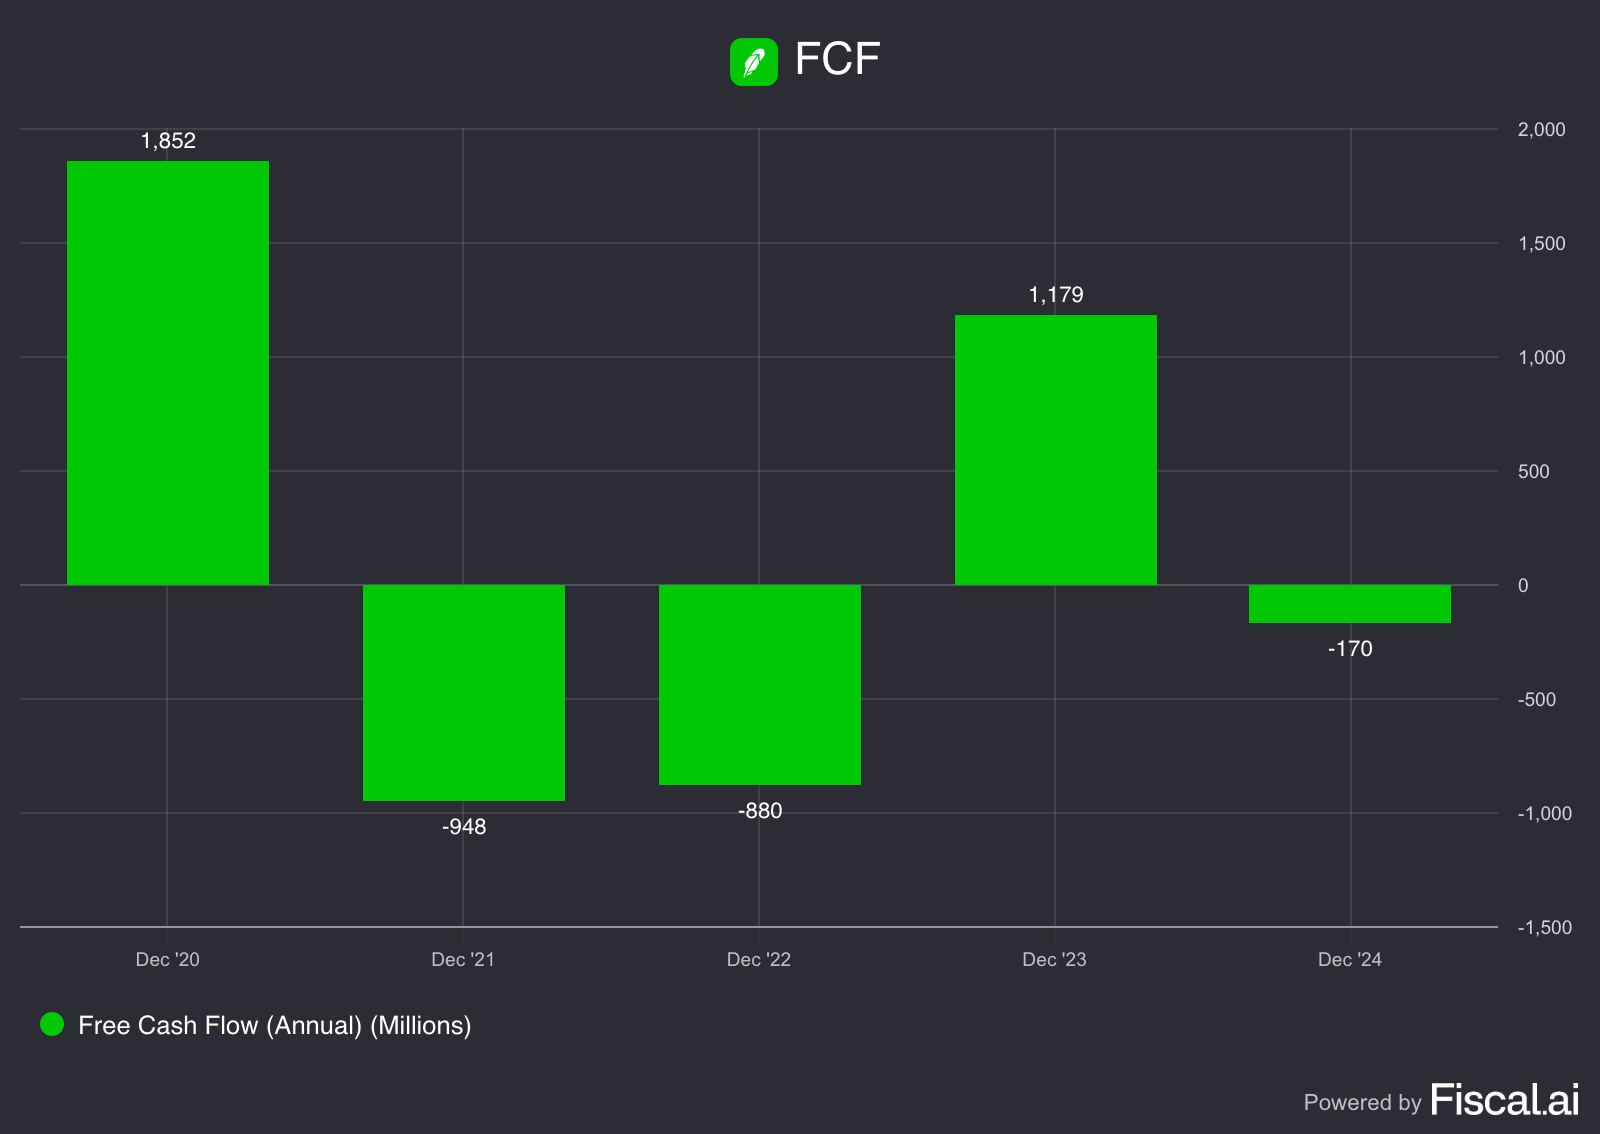
Robinhood's free cash flow reveals a volatile pattern reflecting the company's operational challenges and recovery over five years. The company generated strong positive cash flow of $1.9 billion in 2020, likely boosted by the pandemic trading boom and customer deposit inflows.
Cash flow then turned significantly negative with outflows of $948 million in 2021 and $880 million in 2022, as the company invested heavily in growth while facing regulatory costs and operational scaling challenges. The recovery began in 2023 with positive cash flow of $1.2 billion, demonstrating improved cash management and operational efficiency.
However, 2024 showed a modest negative cash flow of $170 million, suggesting ongoing investments or working capital changes despite the company's return to profitability. This pattern illustrates Robinhood's journey through rapid growth, operational restructuring, and the ongoing balance between profitability and strategic investments.
If you like seeing the charts you should definitely go and check out Fiscal.ai, it’s a free to use stock research tool. If you like it, feel free to check it out through my link:
https://finchat.io/pricing/referralCode=eU7MvaPHfoU2sG5QDaSoUYVvpEb2
(Ps: I don’t get any money out of this, I just get to Unlock Pro for free for 1 month for every user I refer to FiscalAI)
KPI’s
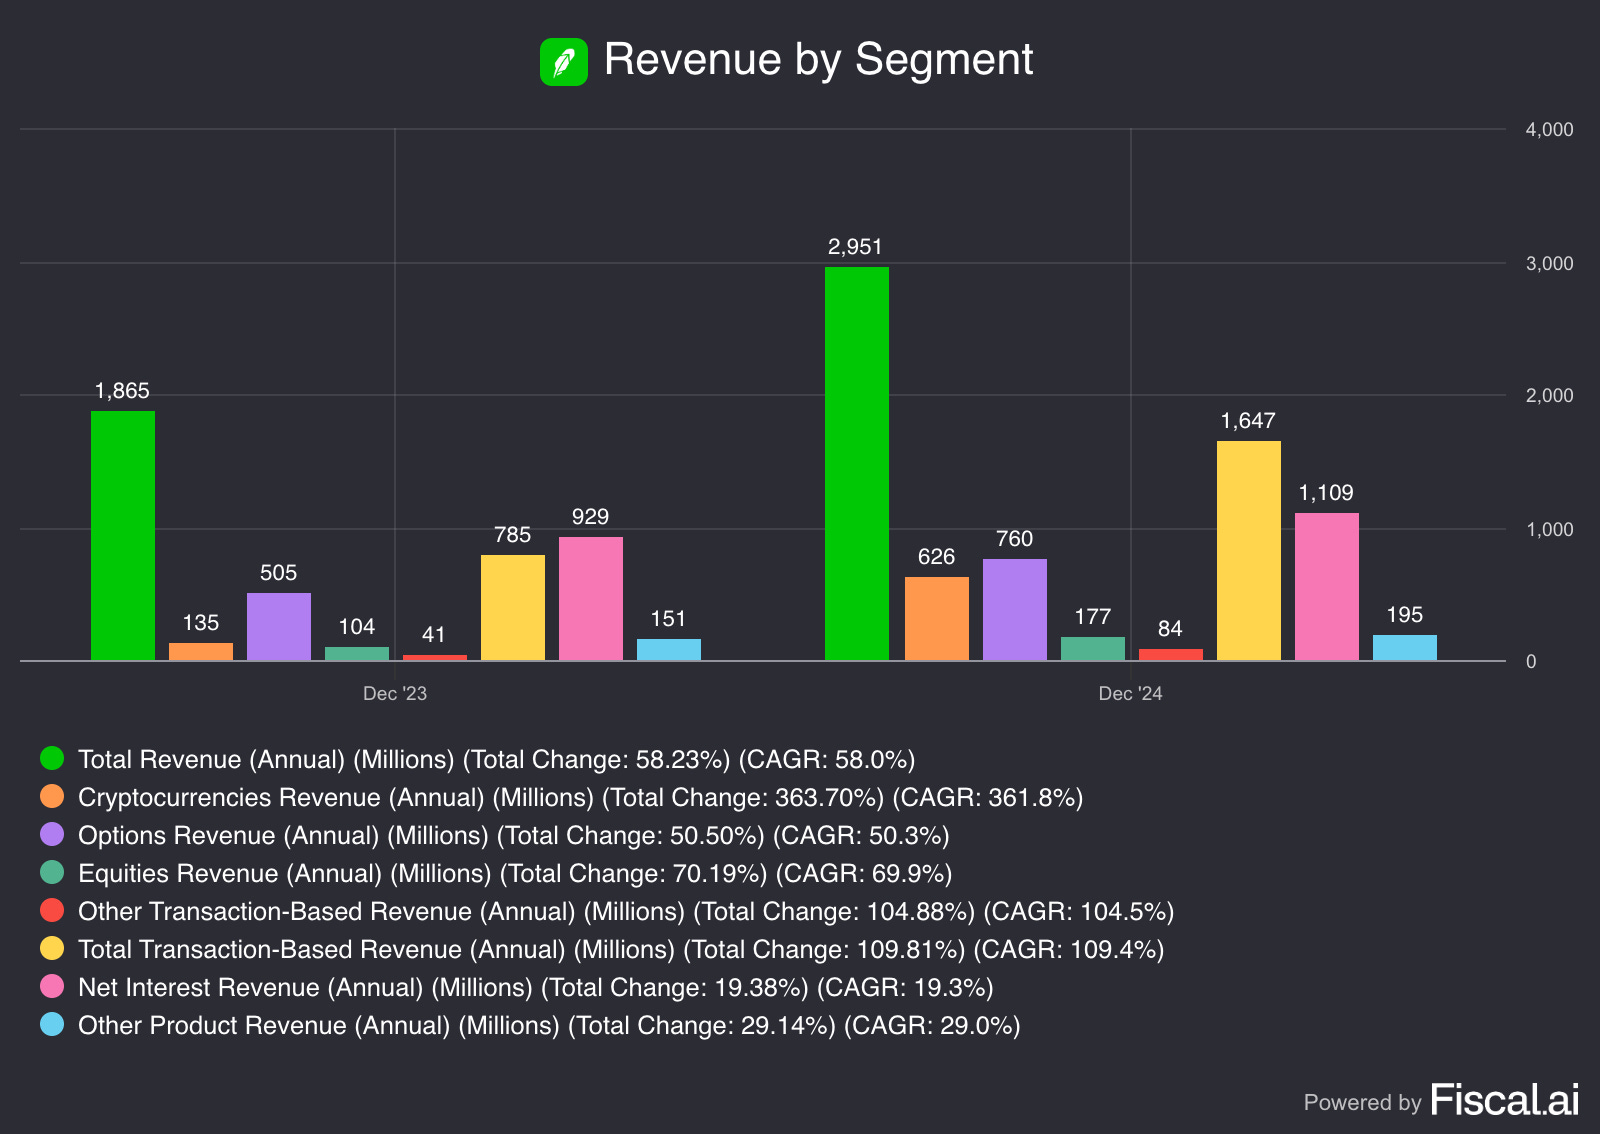
Robinhood's revenue by segment reveals significant diversification and growth across all business lines from 2023 to 2024. Total revenue increased 58% from $1.9 billion to $3.0 billion, driven by strong performance across multiple segments.
Transaction-based revenue emerged as the largest growth driver, more than doubling from $785 million to $1.6 billion with a 110% increase. This includes dramatic growth in cryptocurrency revenue, which surged 364% from $135 million to $626 million, reflecting the crypto market recovery and increased trading activity from last year.
Net interest revenue also showed substantial growth, rising 19% from $929 million to $1.1 billion, demonstrating the value of Robinhood's cash management and lending services. Options revenue grew 51% from $505 million to $760 million, while equities revenue increased 70% from $104 million to $177 million.
This diversified growth pattern illustrates Robinhood's successful evolution from a primarily equity focused platform to a comprehensive financial services provider with multiple revenue streams, reducing dependence on any single business line while capitalising on various market opportunities.
The results highlight that Robinhood is getting more in flow from crypto, making options a less depended revenue segment for them.
Another interesting KPI, is the following one:

Total assets under custody experienced dramatic growth from 2023 to 2024, nearly doubling from $102.6 billion to $192.9 billion, representing an 88% increase. This substantial growth reflects both market appreciation and continued customer acquisition and engagement.
The composition shows strong diversification across asset classes. Equities assets under custody grew 88% from $69.4 billion to $130.6 billion, remaining the largest component and benefiting from the strong equity market performance in 2024. Cash held by users increased 56% from $21.3 billion to $33.3 billion, demonstrating growing customer deposits and cash management usage.
Cryptocurrency assets under custody showed remarkable growth of 139% from $14.7 billion to $35.2 billion, reflecting both the crypto market recovery and Robinhood's expanding crypto offerings. Options and futures assets tripled from $600 million to $1.8 billion, indicating growing sophistication among users.
This growth pattern illustrates Robinhood's success in attracting and retaining customer assets across multiple investment categories, positioning the platform as a comprehensive wealth management destination rather than just a trading app.
If you like what you are reading thus far, make sure to SUBSCRIBE so you don’t miss any posts!
Skin in the game
"Skin in the game" matters for investors evaluating management commitment.
Robinhood Markets Inc. (HOOD) has insider ownership of just around 14%, well above the ideal 10% benchmark that typically aligns management incentives with shareholders.
This high ownership signals high personal commitment from leadership, potentially strengthening accountability and long term thinking.
Gross Profit and Net Income Margin
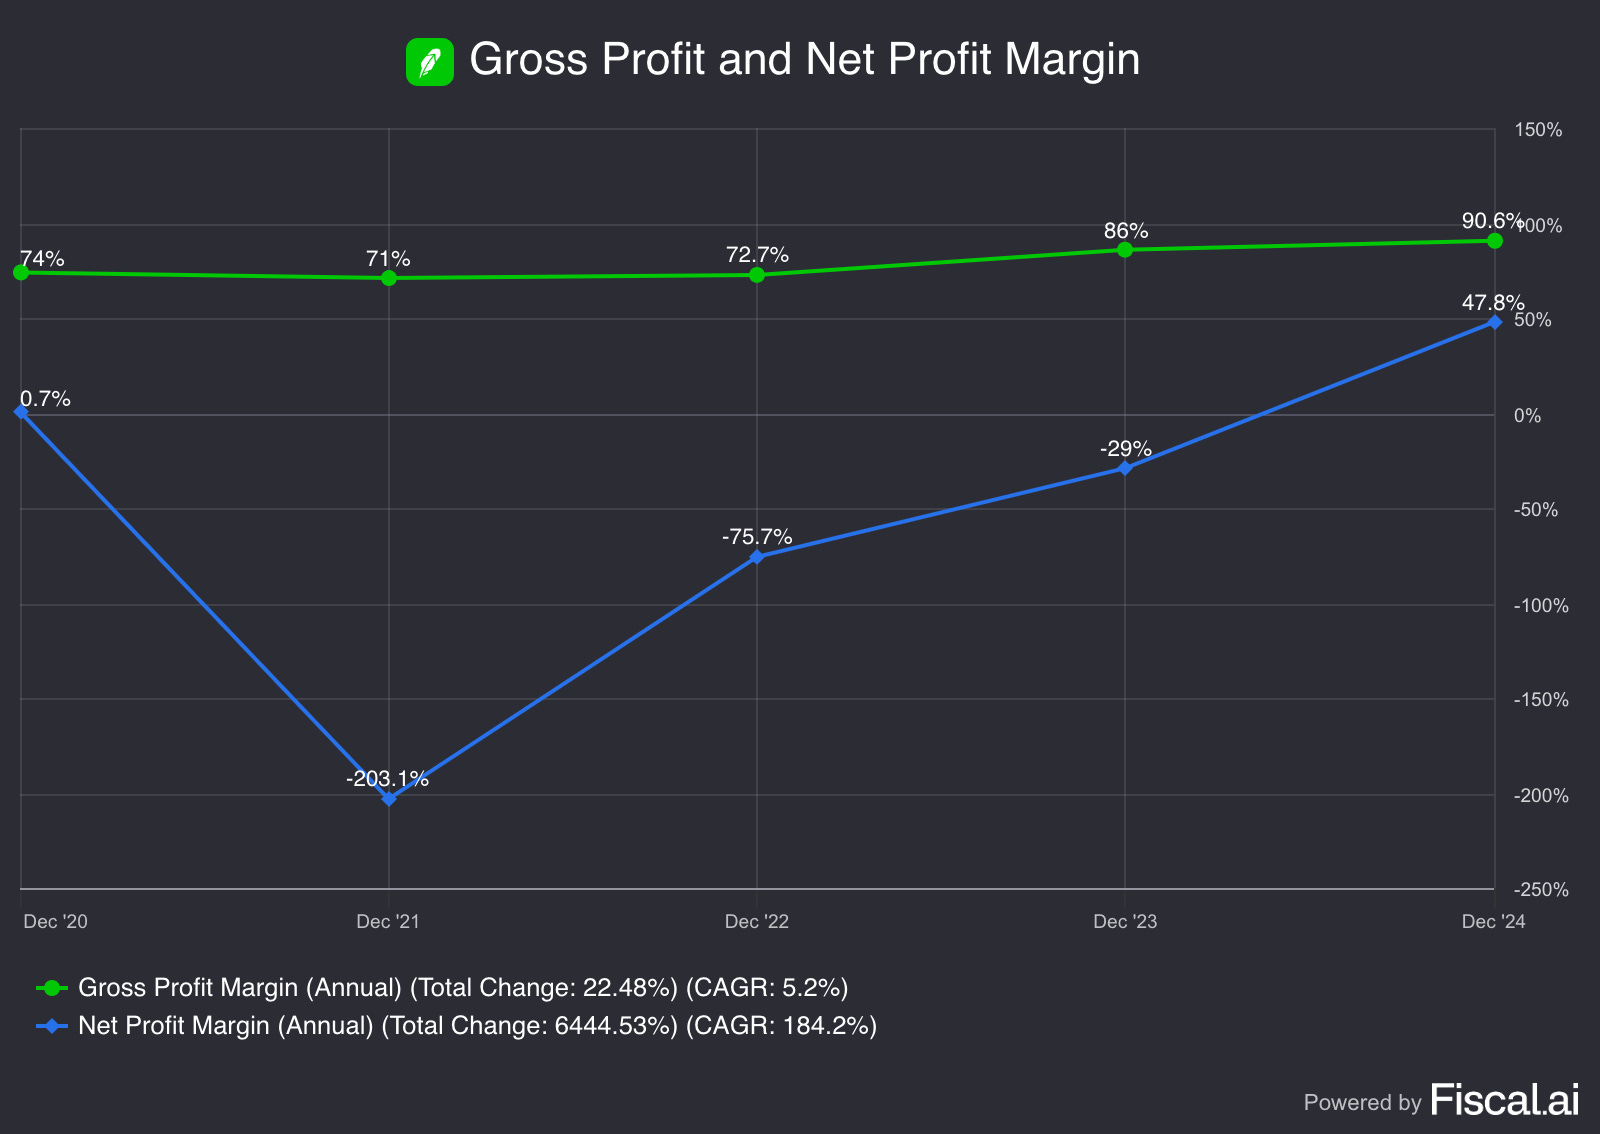
Margins tell a compelling story of operational transformation from 2020 to 2024. While gross profit margins remained relatively stable throughout the period, fluctuating between 71% and 90%, the company maintained strong pricing power and cost control at the service delivery level.
The dramatic shift occurred in net profit margins, which plummeted from a modest 0.7% in 2020 to a massive -203% loss in 2021 during the company's rapid expansion phase. The recovery journey was gradual but consistent, with net margins improving from -76% in 2022 to -29% in 2023, before achieving a remarkable turnaround to 48% profitability in 2024.
This transformation reflects Robinhood's successful transition from a growth at all costs strategy to disciplined operational execution. The company maintained its ability to generate strong gross profits while dramatically improving its cost structure and operational efficiency, ultimately achieving industry leading net profit margins by 2024 and demonstrating the scalability of its business model.
If you need more information on Robinhood’s Business Model, and specifically in depth information on where most of their revenue is coming from, go and check out this article:

Return on Invested Capital (ROIC)
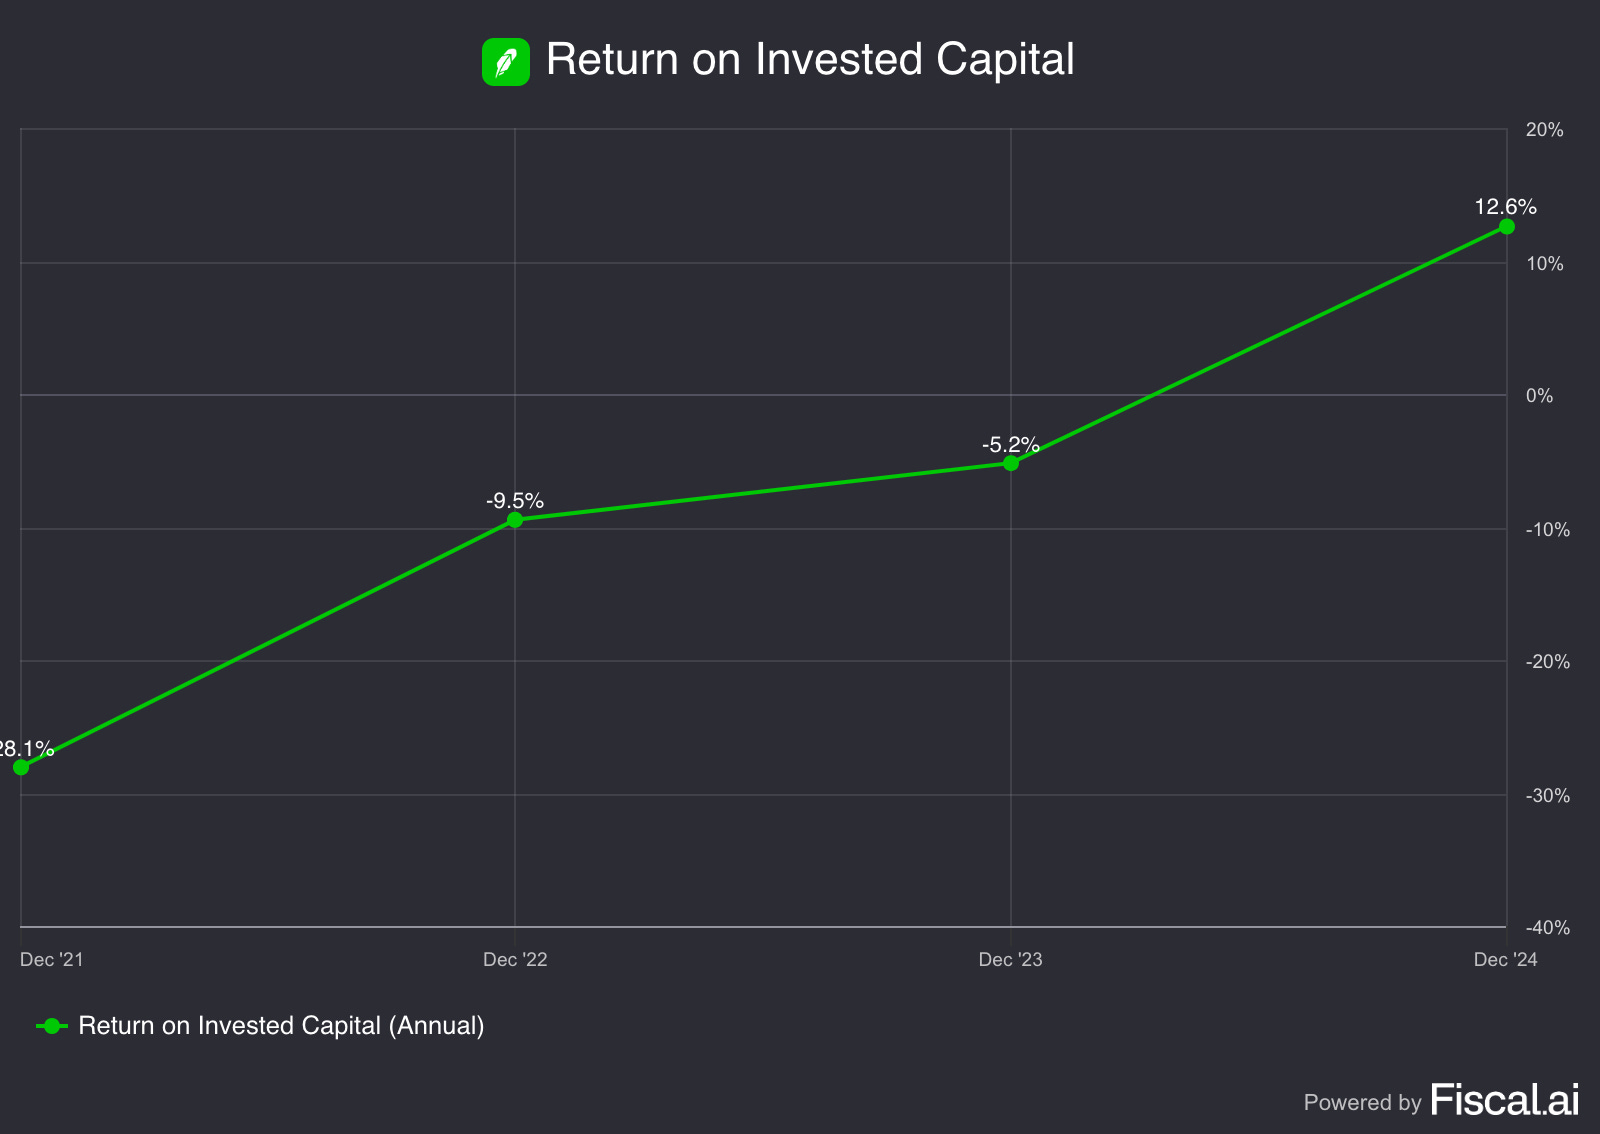
Over the past few years, Robinhood’s return on invested capital (ROIC) has augmented significantly, indicating that the company is making good investment decisions.
A 12.6% ROIC is fantastic. It shows how management is able to allocate capital in an efficient matter.
Goodwill
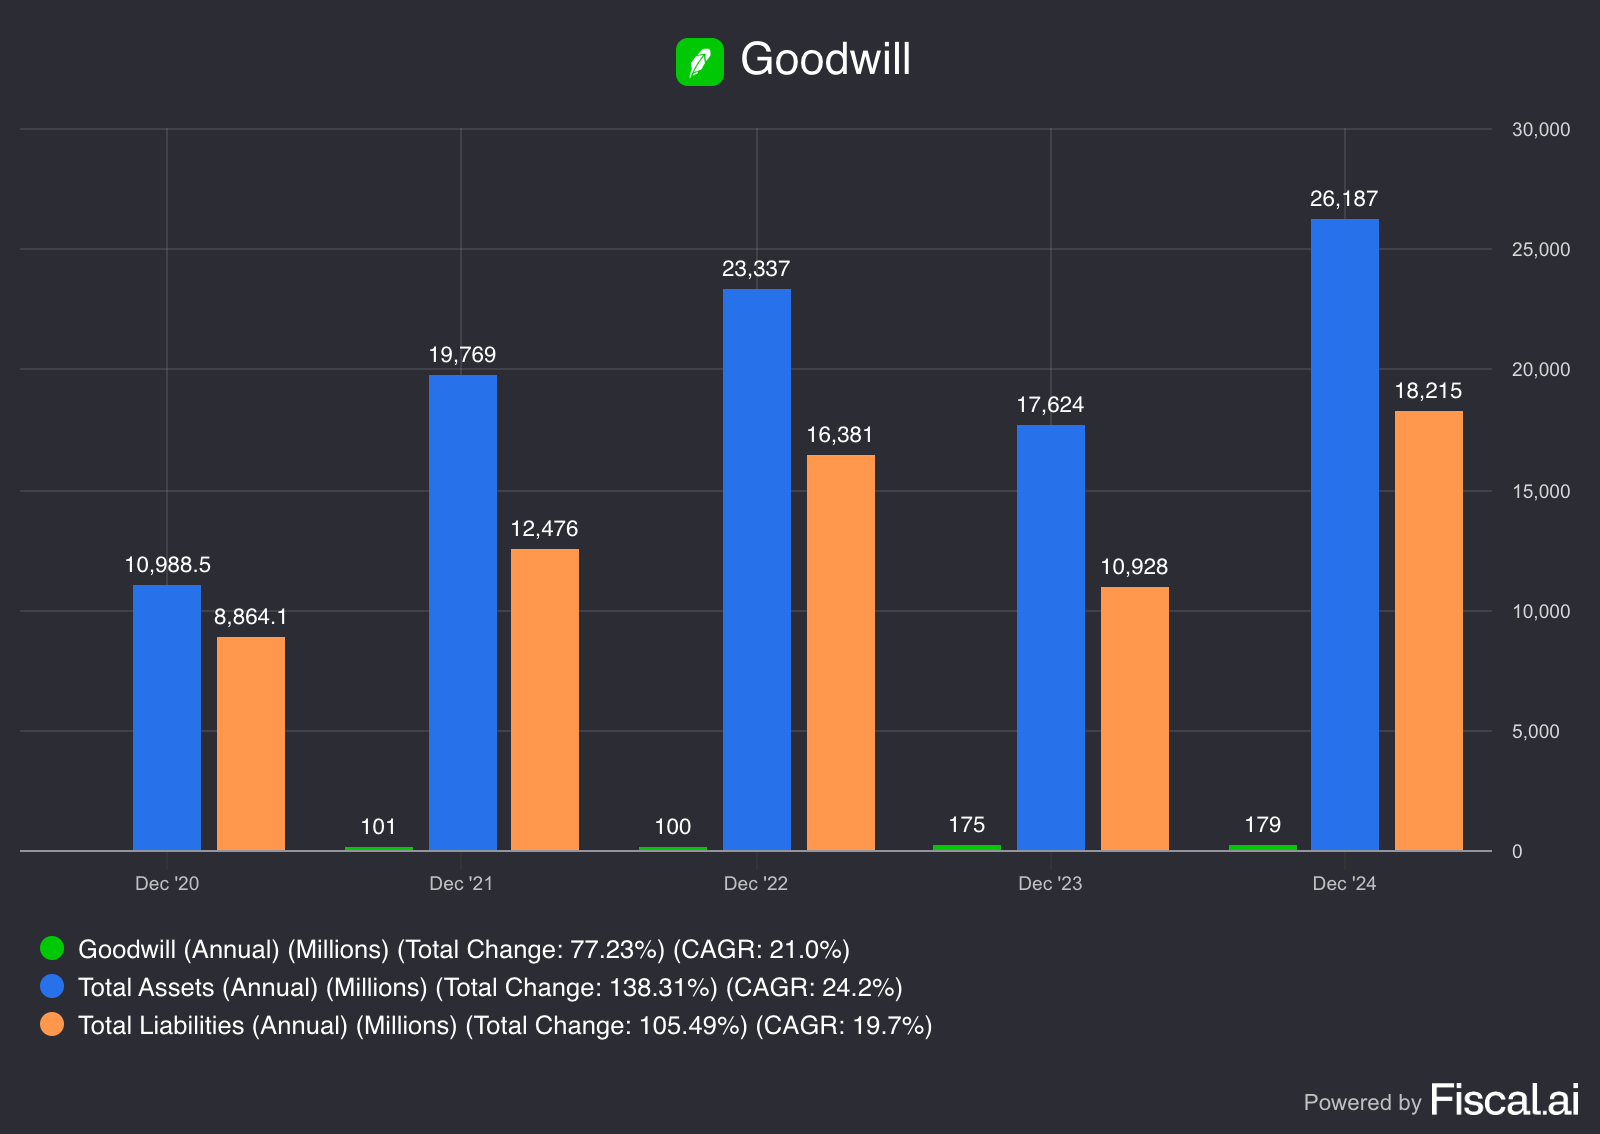
Balance sheet expansion has been the defining feature of this company's growth trajectory over the past four years. Total assets have surged from $10.99 billion in December 2020 to $26.19 billion by December 2024. This dramatic scaling reflects aggressive business expansion and likely significant acquisitions.
Goodwill has been the primary driver of this growth, climbing from $101 million to $179 million. While modest in absolute terms, this represents substantial intangible asset accumulation, suggesting the company has been actively acquiring other businesses and paying premiums for their strategic value.
Total liabilities have also expanded meaningfully, rising from $8.86 billion to $18.22 billion. The growth in liabilities has been slightly more measured than asset growth, indicating the company has maintained reasonable leverage while funding its expansion. The parallel growth of assets and liabilities suggests disciplined capital management during a period of rapid scaling.
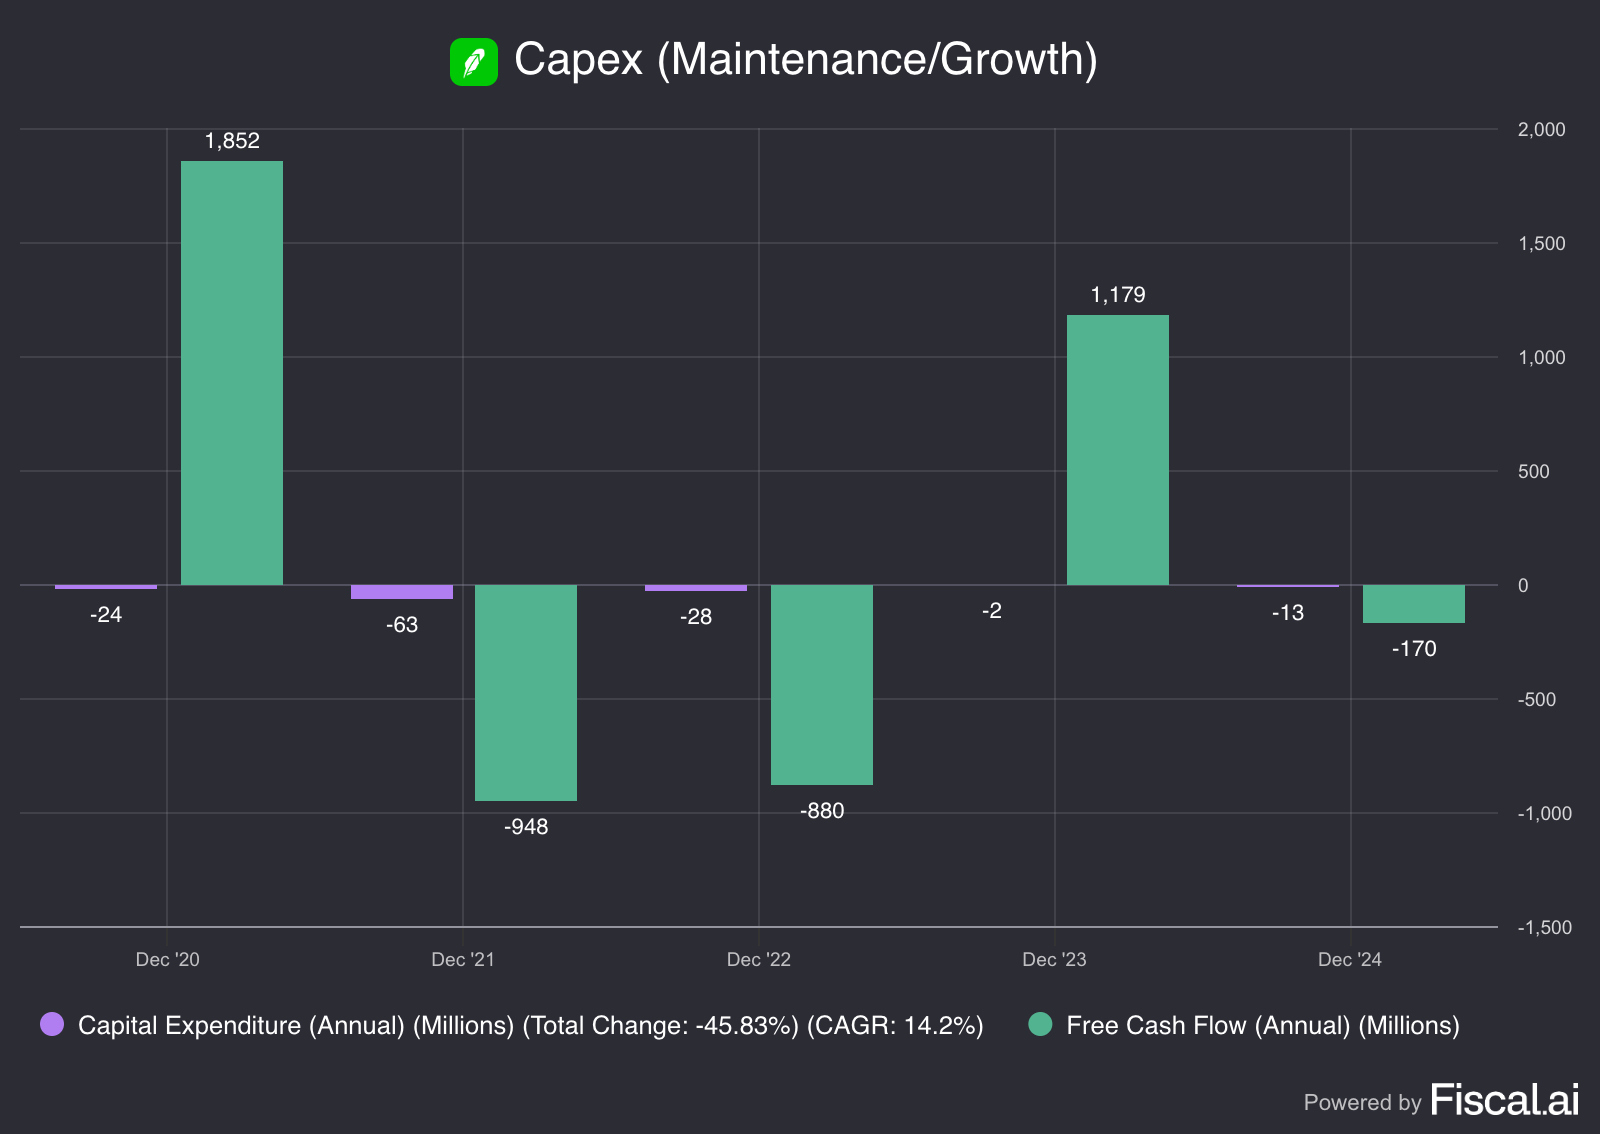
Capex (Maintenance/Growth)
Capital expenditures have declined sharply from $63 million in December 2021 to just $13 million by December 2024. This pullback in investment spending suggests either a maturing business model or a deliberate shift toward capital efficiency.
Free cash flow has shown remarkable volatility throughout this period. After generating $1.85 billion in December 2020, the company experienced significant cash outflows of $948 million and $880 million in 2021 and 2022 respectively. This dramatic swing from positive to negative cash generation likely reflects major business investments, acquisitions, or operational challenges during the expansion phase.
The recovery has been impressive, with free cash flow rebounding to $1.18 billion in December 2023 before moderating to negative $170 million in 2024. This pattern suggests the company has moved through a heavy investment cycle and is now focusing on cash generation rather than growth spending. The combination of reduced capex and improving cash flow dynamics indicates a business prioritising profitability and capital returns over aggressive expansion.
If you like what you are reading, make sure to SUBSCRIBE so you don’t miss any posts!
Stock Based Compensation
Stock-Based Compensation (SBC) is a non-cash expense which means that it affects financial statements but does not directly impact Free Cash Flow (FCF).
However, it does have indirect effects on a company’s financial health and valuation.
How SBC Affects Free Cash Flow
SBC is Added Back to Operating Cash Flow (OCF):
Since SBC is a non-cash expense, it is deducted from net income on the Income Statement but added back when calculating Operating Cash Flow under the indirect method of cash flow reporting.
This can make FCF appear higher, even though it does not actually generate cash.
Potential Dilution Impact:
While SBC increases FCF in the short term (since it's a non-cash expense), it leads to more outstanding shares over time, which can dilute earnings per share (EPS) and affect stock value.
Investors should be cautious when high SBC artificially boosts FCF while increasing share dilution.
Adjusted Free Cash Flow (Adj. FCF)
To account for SBC’s impact, some investors use an adjusted FCF metric:
Adjusted FCF = FCF − SBC
This adjustment gives a more conservative view of true cash generation by treating SBC as an actual cost to shareholders.
Let’s now take a look at Robinhood’s Stock-Based Compensation:
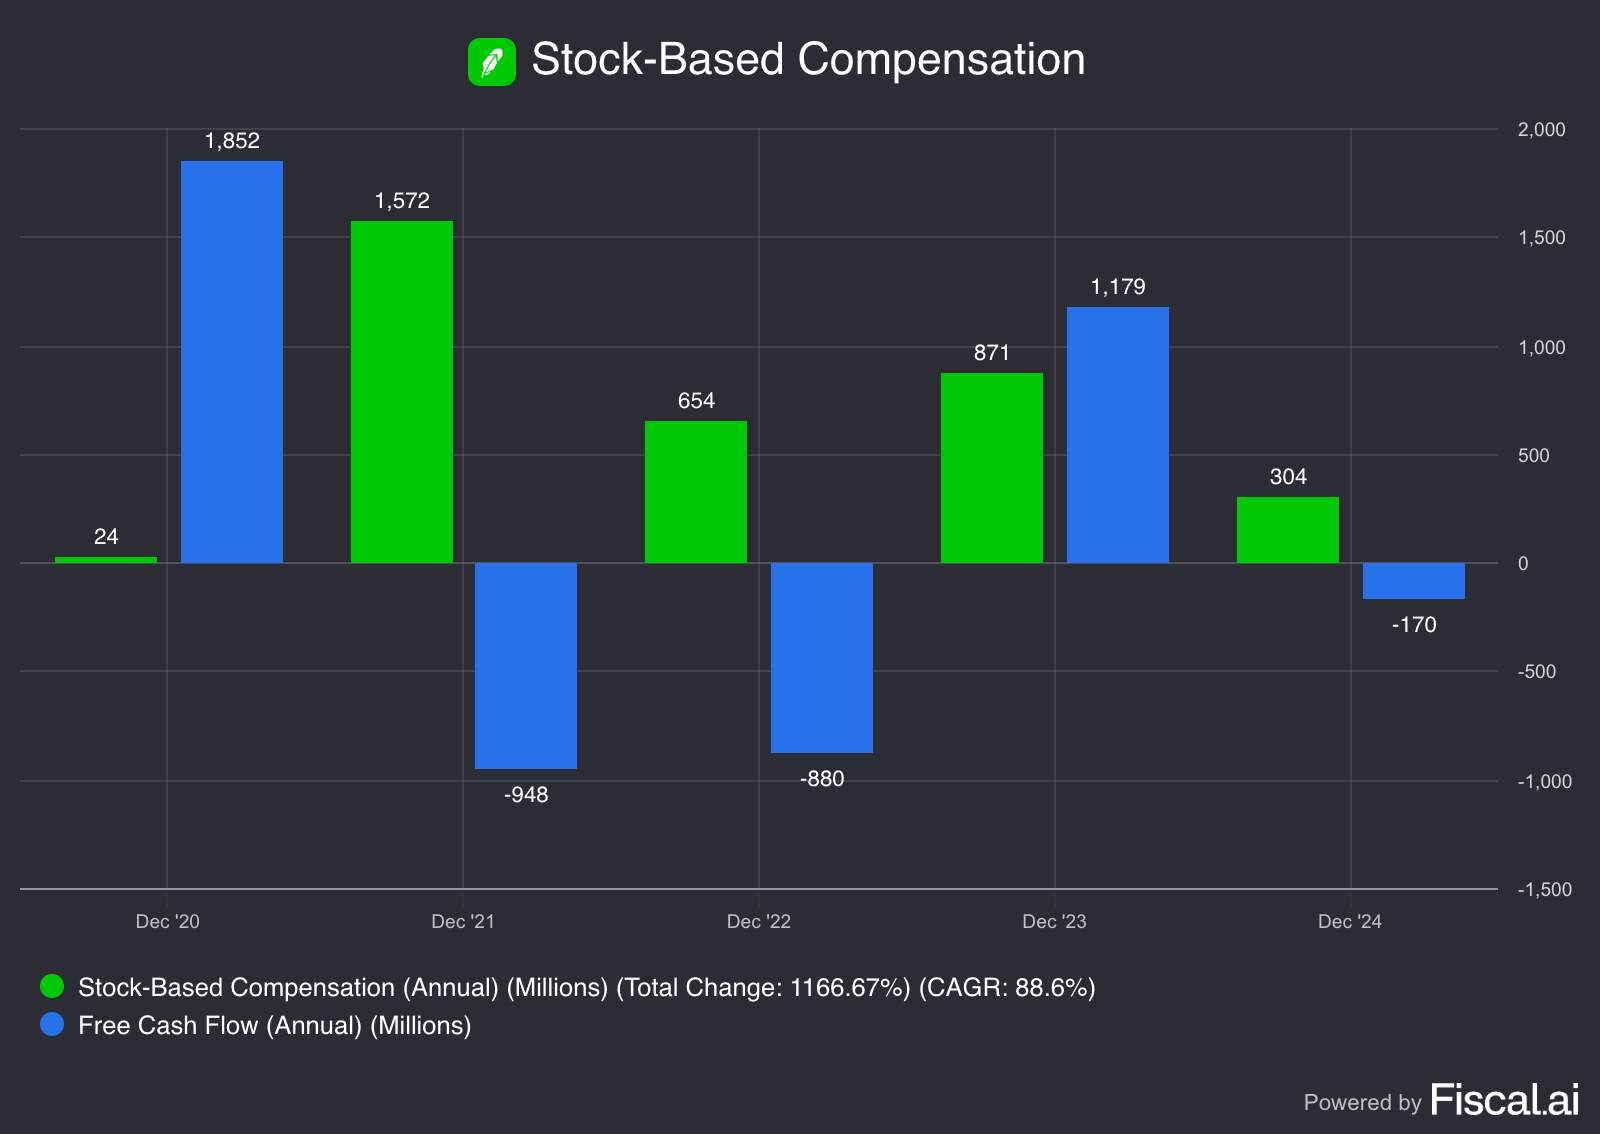
Robinhood has been issuing Stock-Based Compensation (SBC), which impacts its reported free cash flow in a negative way and basically making free cash flow worthless.
However, SBC seems to be declining, which is a positive sign.
Additionally, the gap between FCF and SBC on the other side seems to be getting worse, indicating that SBC’s impact on FCF is gradually increasing again. But, their free cash flow is so unpredictable that the only thing we truly have to collect from this, is the fact that SBC is declining.
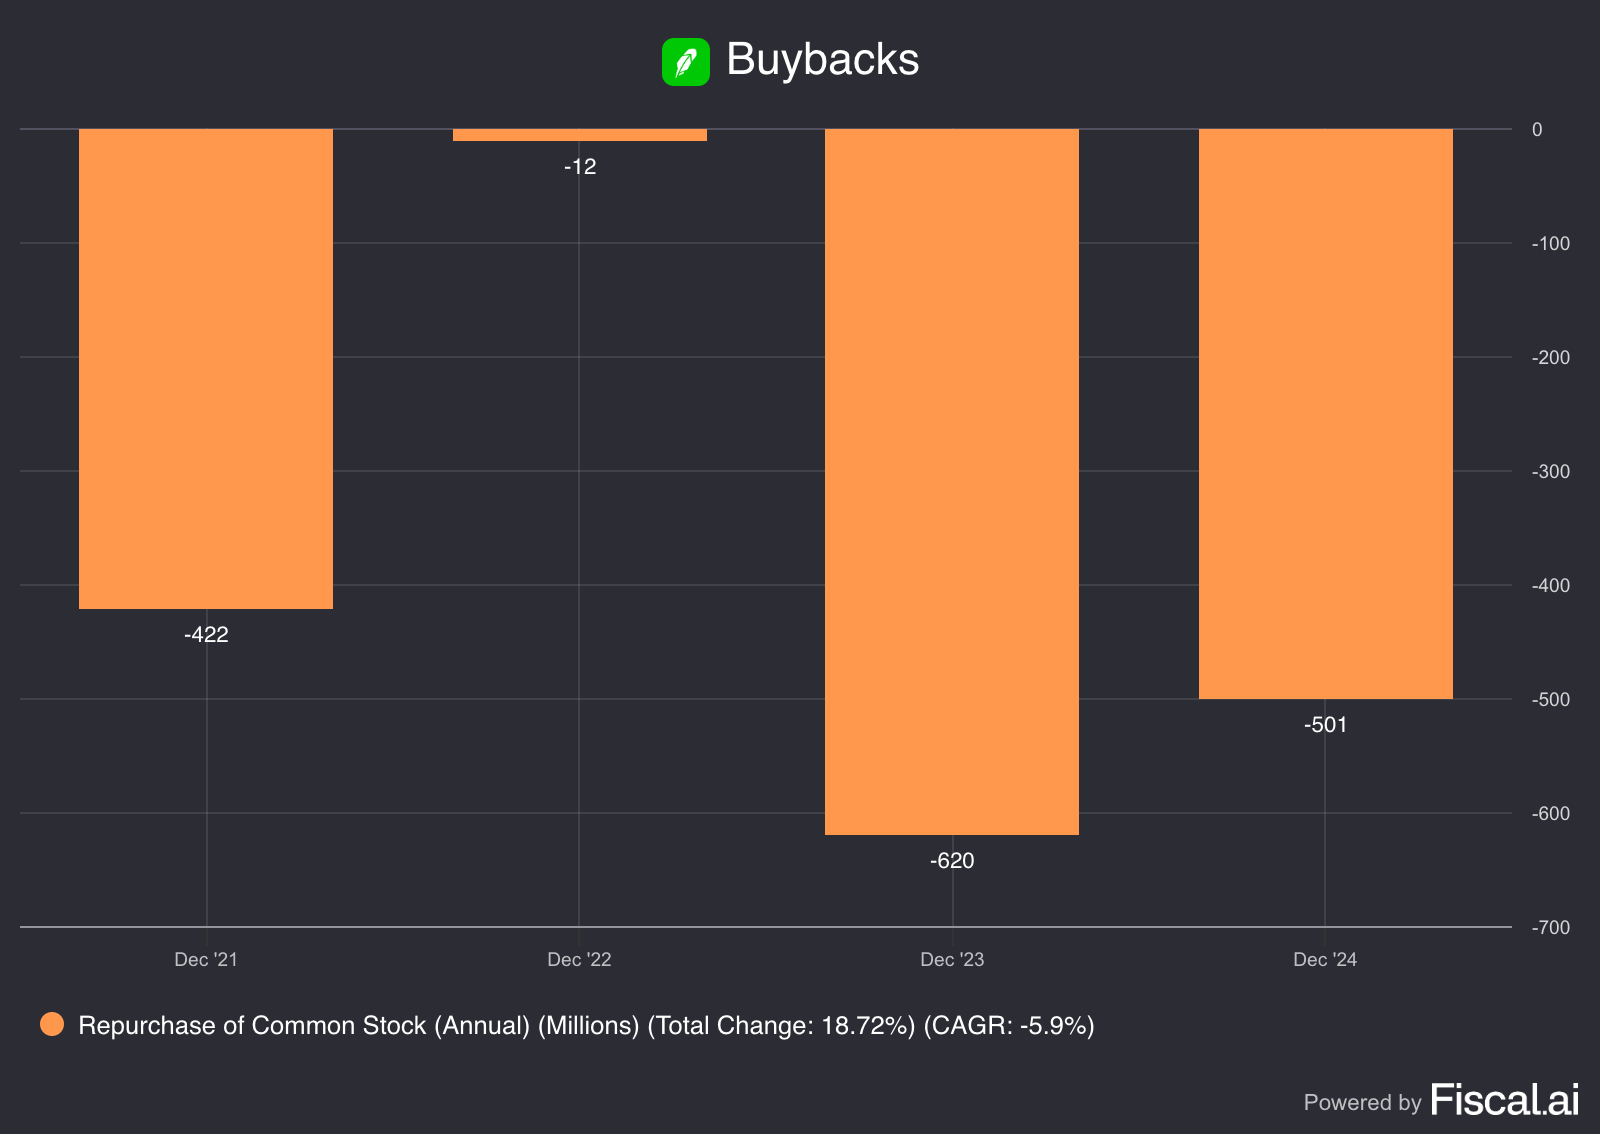
Buybacks
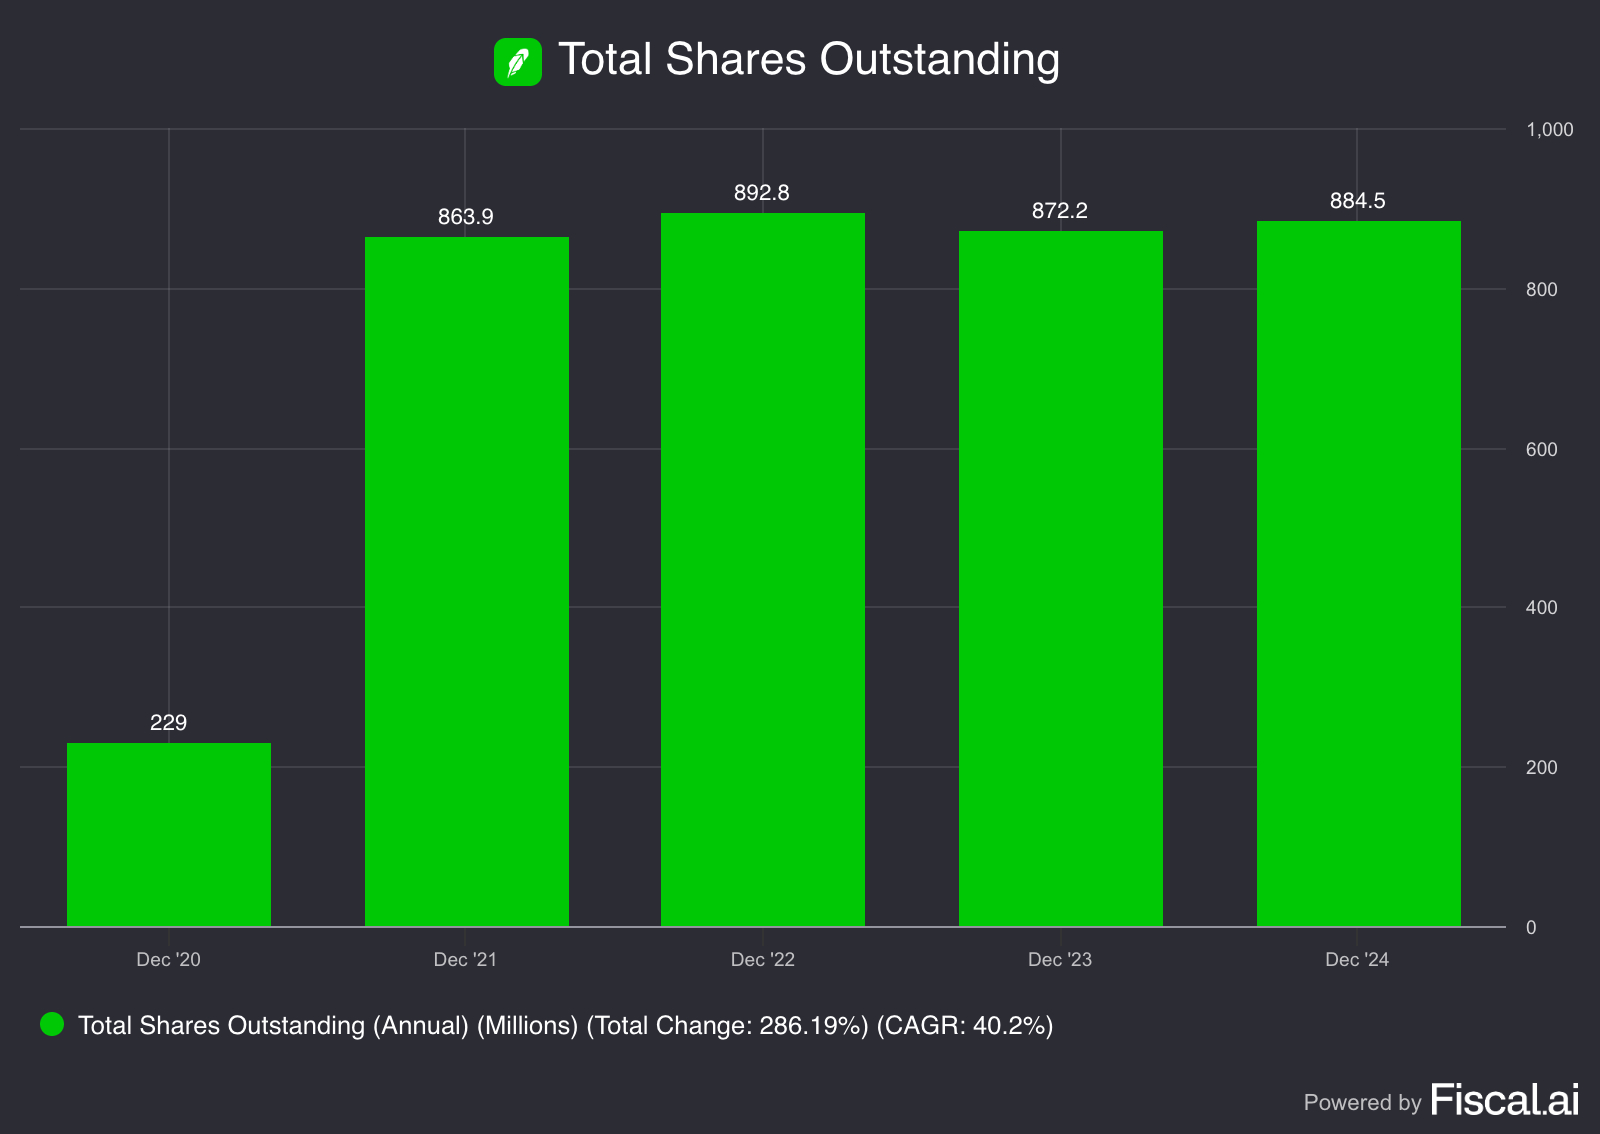
It appears that Robinhood does repurchase shares, it has been repurchasing shares since 2021. Last year, they bought back around 501 million worth of shares out of a total of 883 million shares.
As an investor, share buybacks are generally seen as a positive sign because they can increase the value of the shares you currently own. They often indicate management’s confidence in the company’s future and can help drive long term shareholder value.
If I’m being honest, I’m not the biggest fan of buybacks. I believe companies could put that money to better use by investing in initiatives that genuinely strengthen the business. Rather than spending cash on buybacks, they could focus on areas that drive long term growth and create real value. But hey, I’m just a simple investor, what do I know?
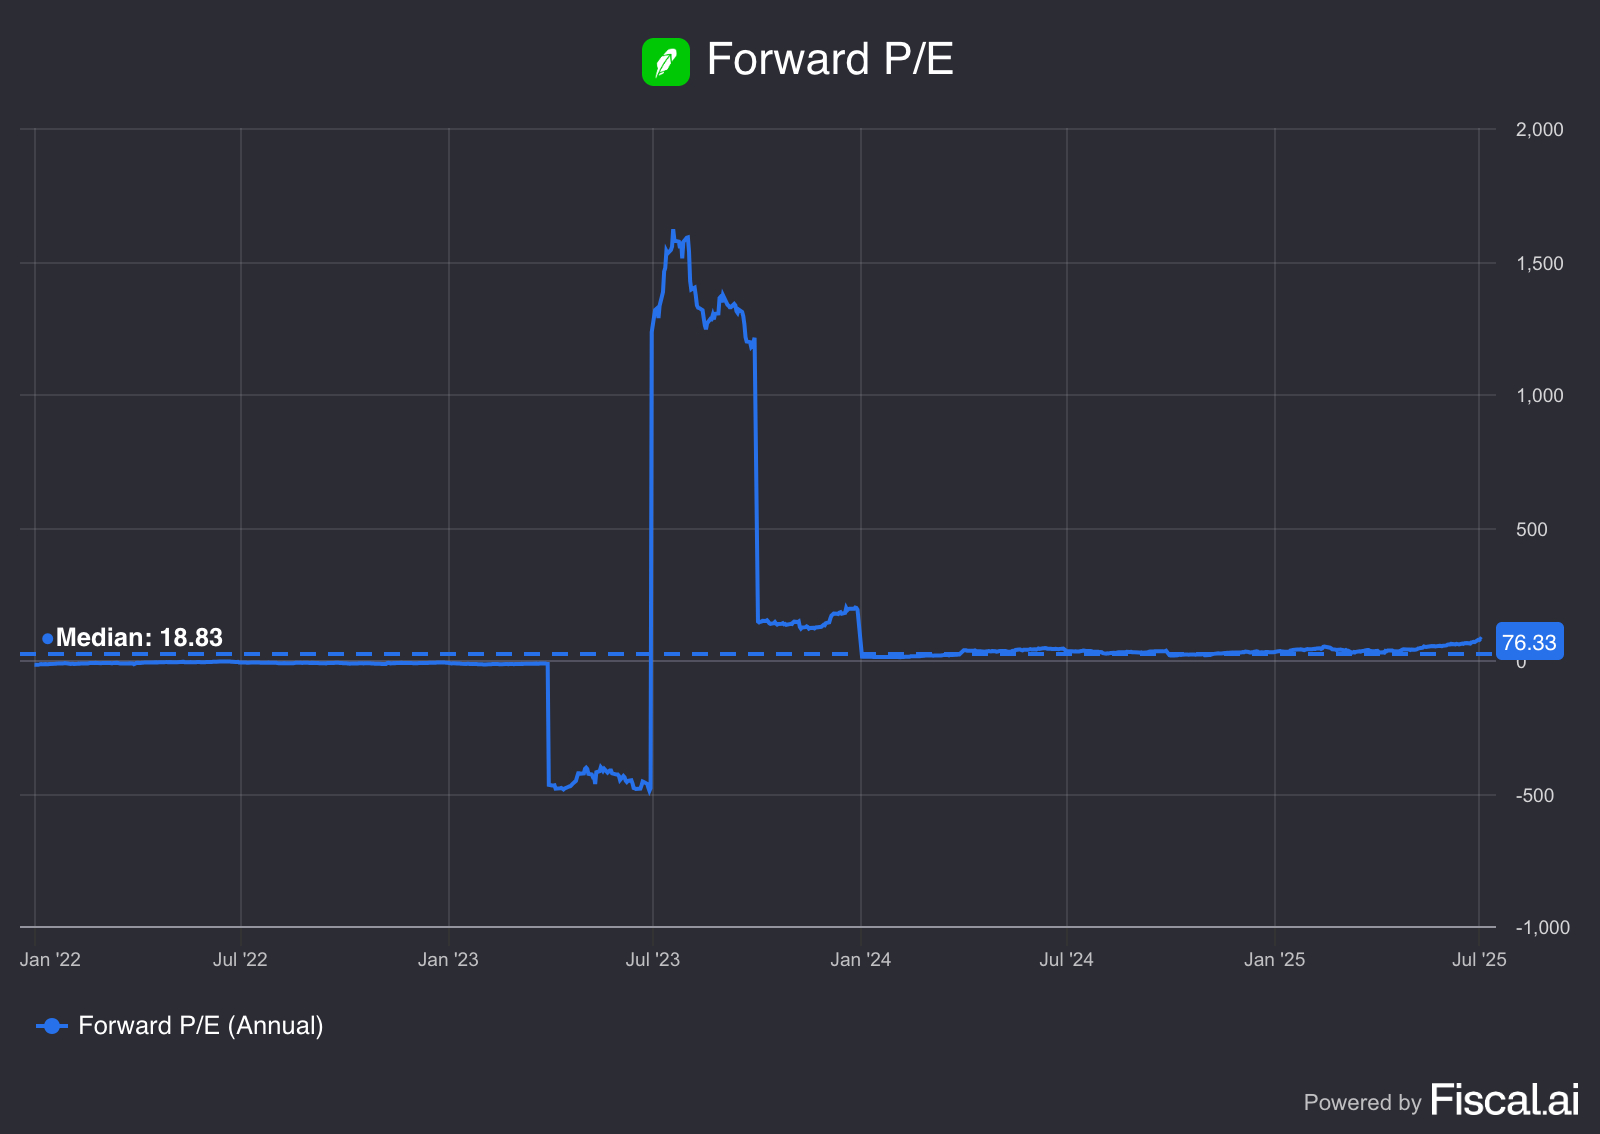
Forward P/E
The forward P/E ratios of Robinhood have experienced a remarkable transformation, particularly in recent months. The longer view reveals extraordinary volatility, with ratios spiking to around 1,600 in mid-2023 before crashing into negative territory and stabilising. The median of 18.83 reflects this turbulent period.
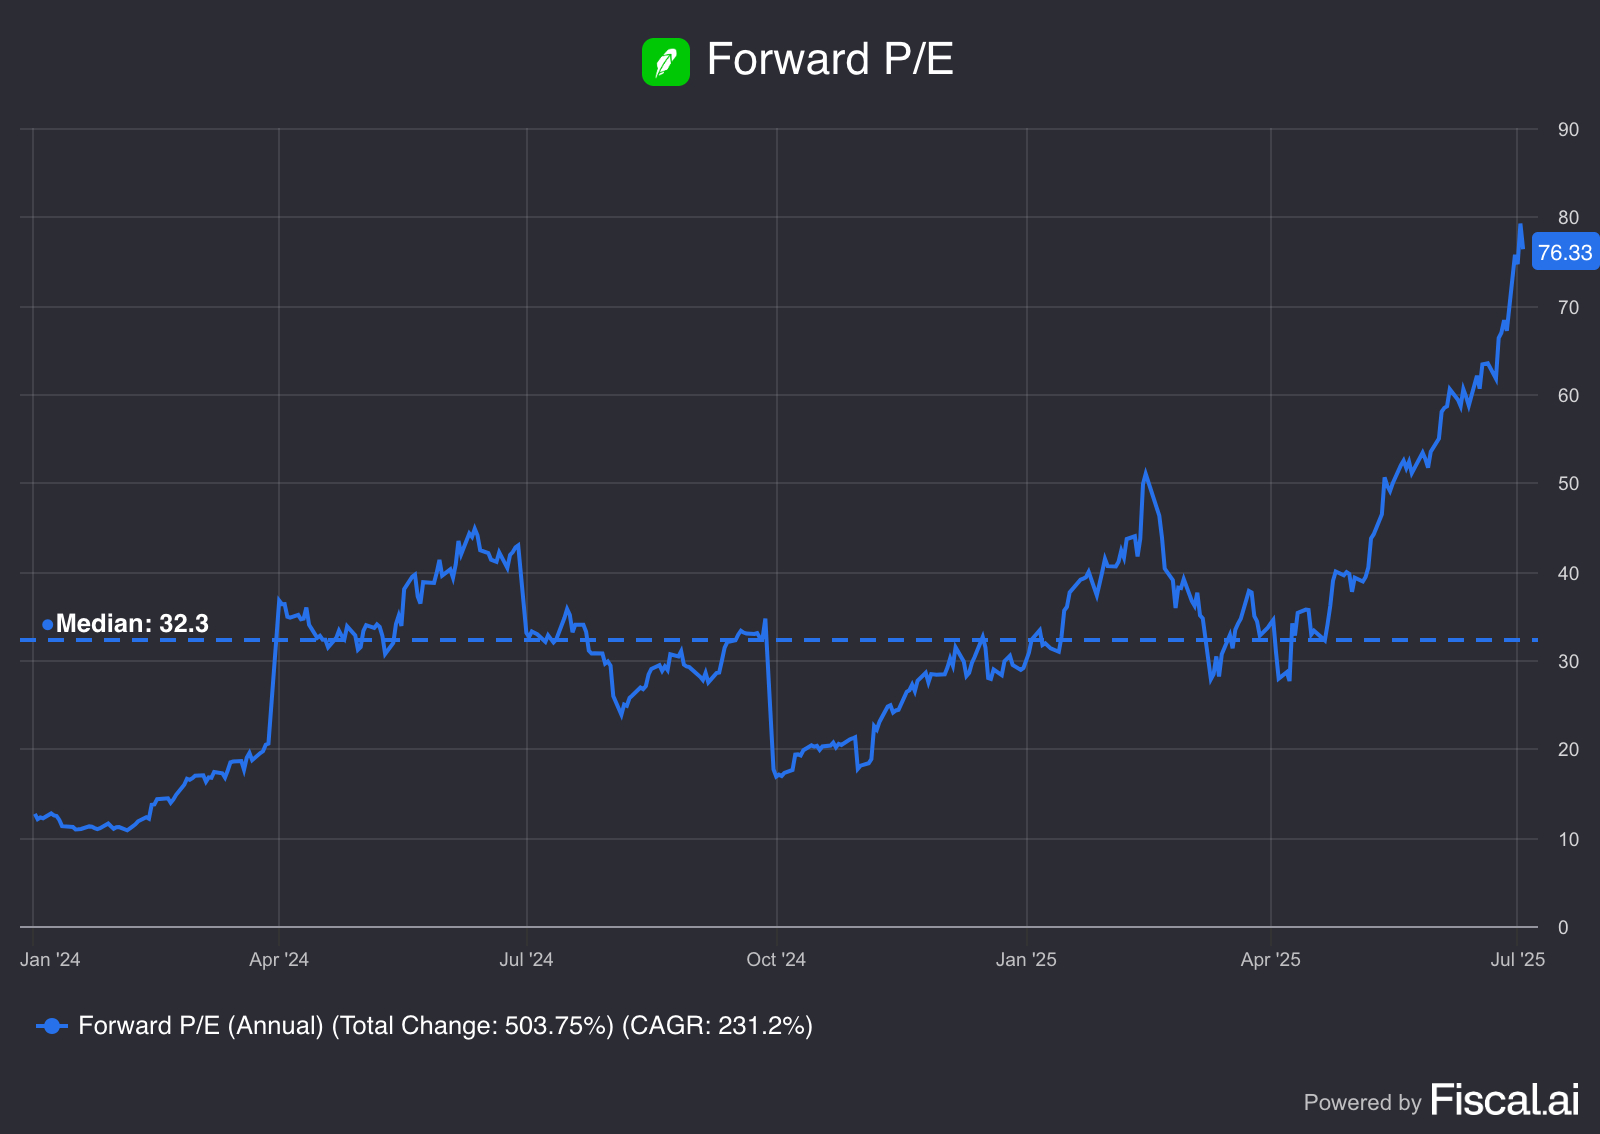
The recent 18 month view shows a powerful upward trend. After hitting lows around 19-20 in late 2024, forward P/E ratios have surged to 76.33, more than doubling. The median of 32.3 for this period shows how significantly valuations have expanded.
This pattern suggests markets are pricing in substantial earnings growth expectations or increased risk premiums. The sustained climb since late 2024 indicates persistent investor optimism, though current levels of 76.33 warrant careful consideration of whether fundamentals can support these elevated multiples. Robinhood coming to the EU and launching it’s newest stock tokenisation in Europe sure got an impact on the price.
When I look at the Forward P/E, I always compare it to the stock’s historical median to get a sense of whether it’s undervalued or overvalued. But it’s also key to remember that this ratio is based on earnings, so if earnings are going down, the multiple can be pretty misleading. A low P/E might look attractive, but it doesn’t mean much if the business is struggling underneath.
Robinhood’s forward P/E is trading well above its historical median, suggesting the stock may currently be overvalued based on this metric.
Forward P/FCF
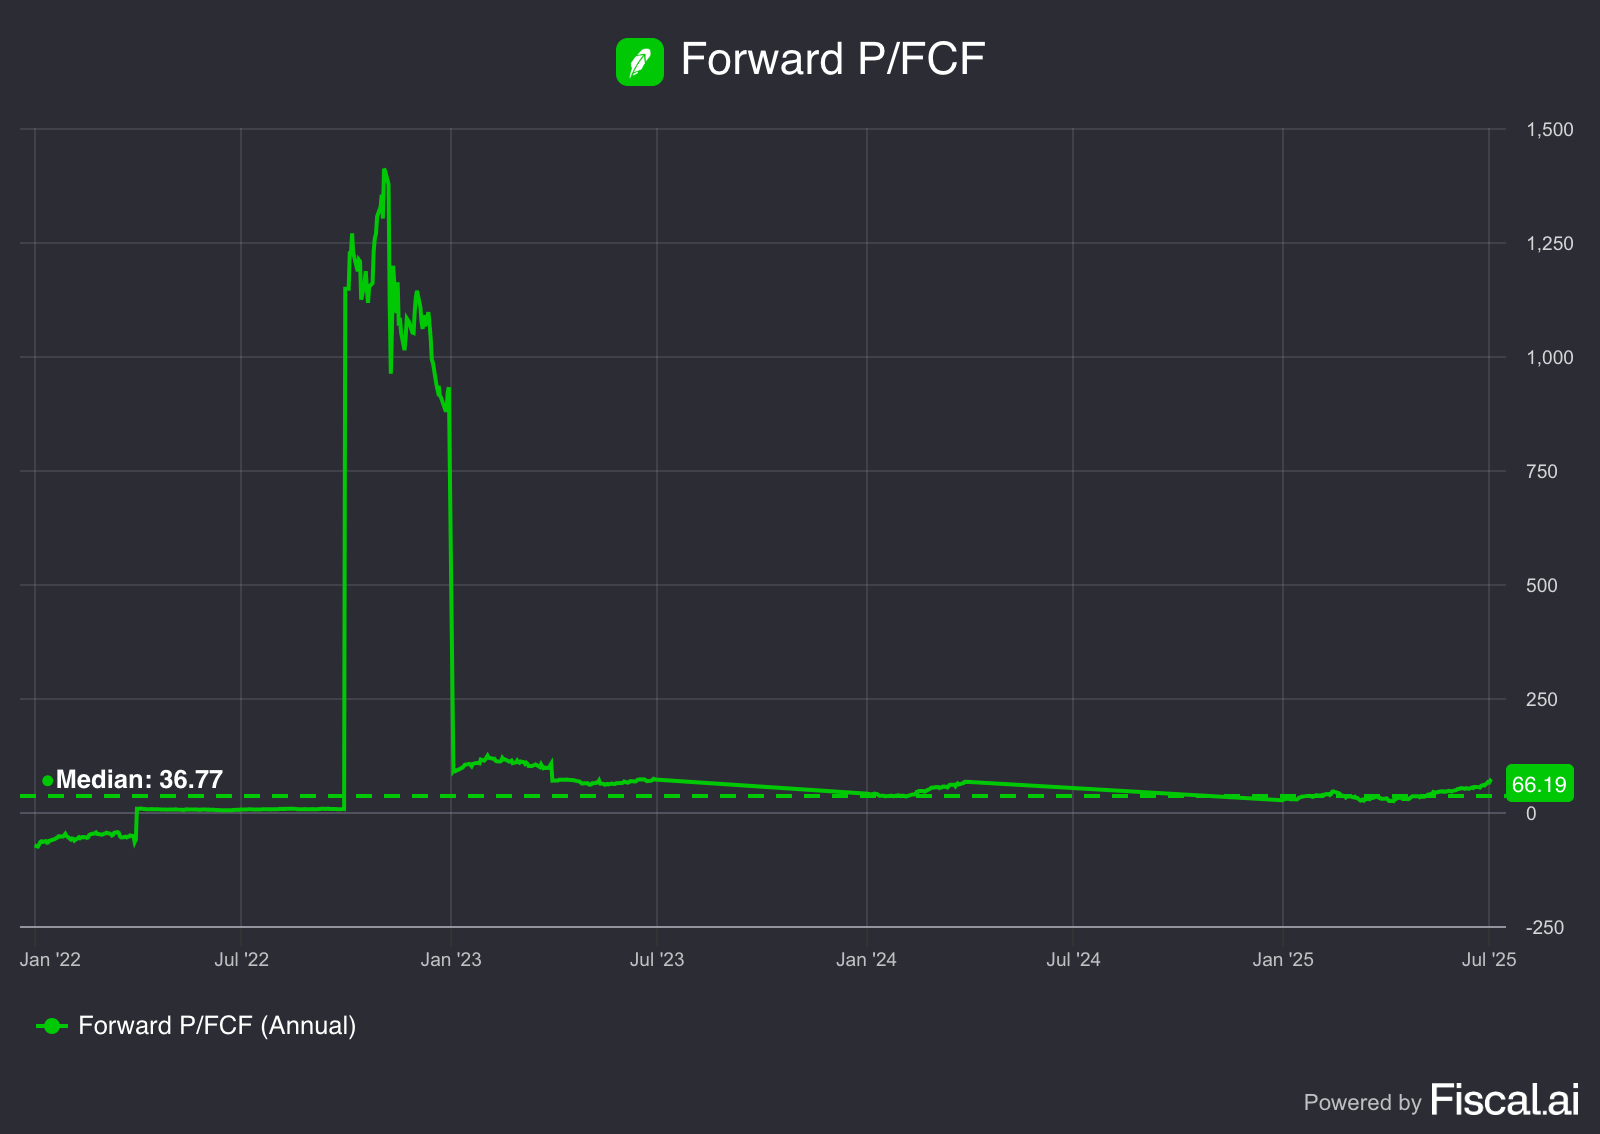
The Forward P/FCF ratio presents a completely different valuation narrative compared to traditional P/E metrics. The three year perspective shows an isolated eruption in late 2022, where ratios spiked to approximately 1,400 before quickly retreating to more normalized levels. Outside of this brief anomaly, the metric has remained relatively stable, with a median of 36.77 and current reading of 66.19.
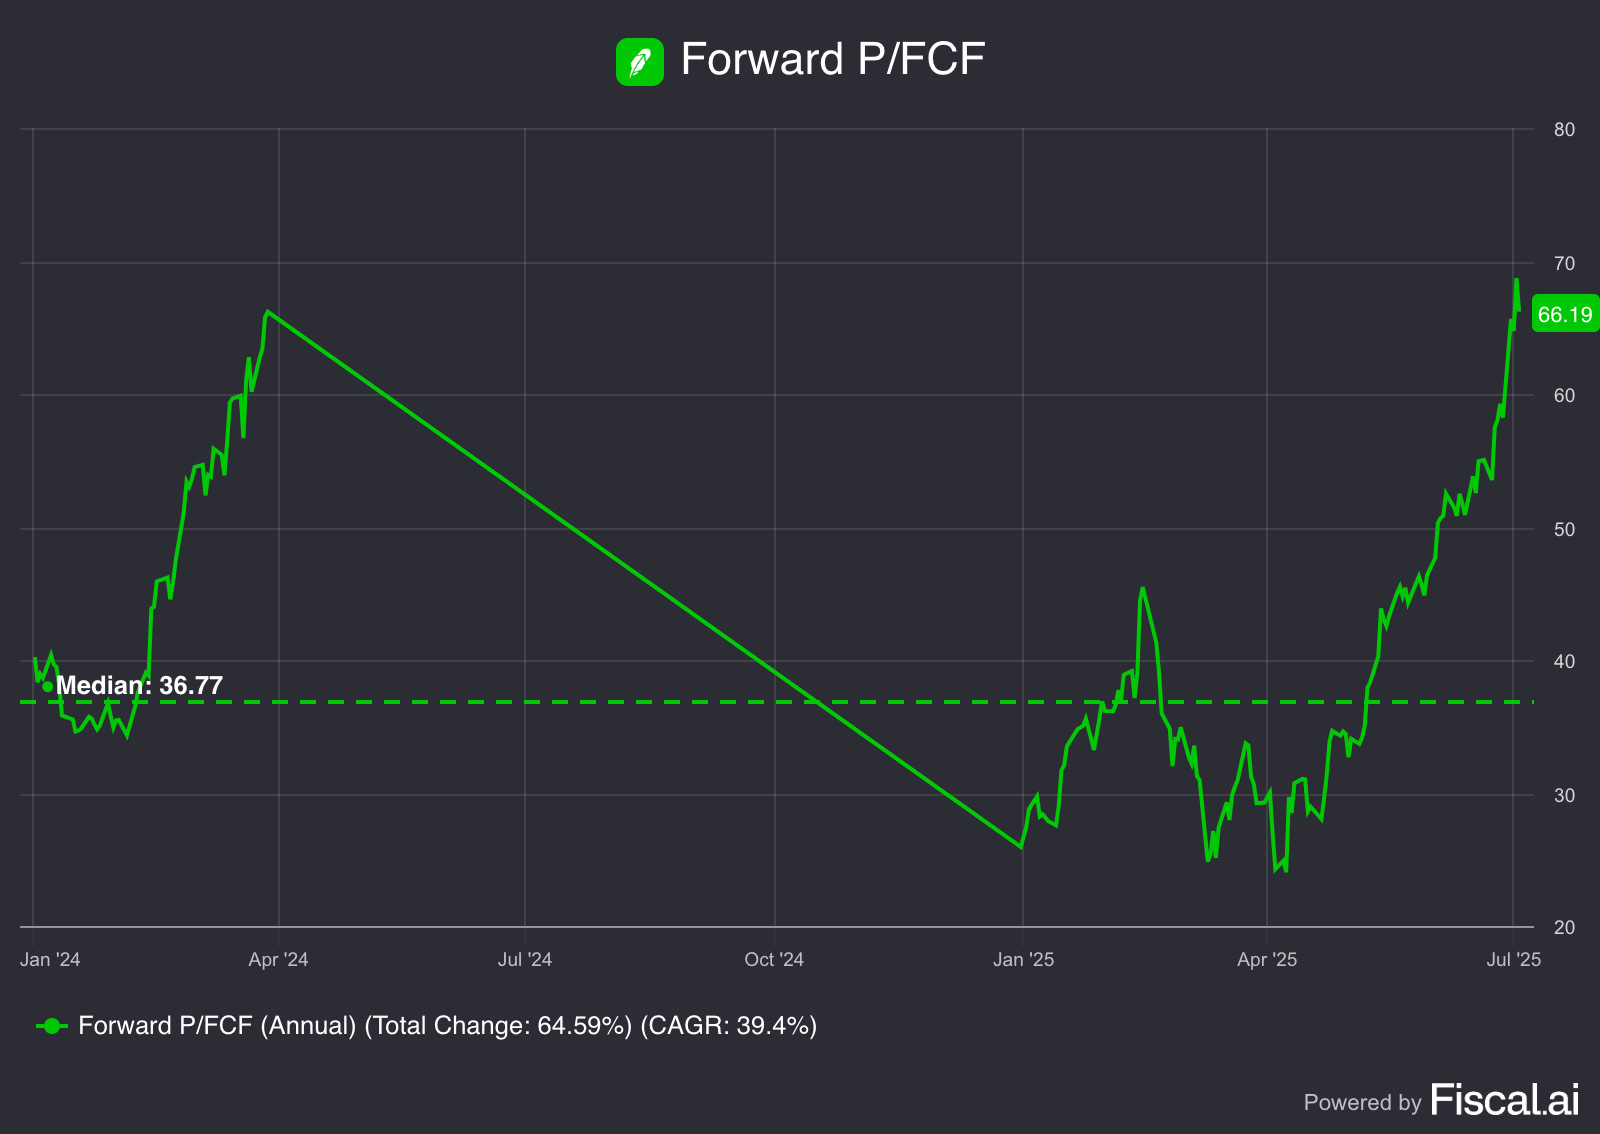
The recent 18 month view reveals a more gradual evolution. After peaking around 67 in early 2024, Forward P/FCF ratios declined steadily through mid-2024, reaching lows near 25. Since then, they've recovered meaningfully, climbing back to 66.19. The consistent median of 36.77 suggests this metric has been less volatile than earnings based valuations.
This cash flow focused measure indicates a market that values actual cash generation over accounting earnings. The recent uptrend suggests investors are willing to pay higher multiples for expected free cash flow, though the 39.4% growth rate is more measured than the explosive moves seen in P/E ratios. Current levels of 66.19 represent a significant premium to the historical median, signaling elevated but not extreme cash flow valuations.
When I look at the Forward P/FCF, I always compare it to the stock’s historical median to get a sense of whether it’s undervalued or overvalued. But it’s also key to remember that this ratio is based on free cash flows, so if free cash flows are going down, the multiple can be pretty misleading. A low P/FCF might look attractive, but it doesn’t mean much if the business is struggling underneath.
Robinhood’s forward P/FCF is trading well above its historical median, suggesting the stock may currently be overvalued based on this metric.
If you like what you are reading, make sure to SUBSCRIBE so you don’t miss any posts!
Earnings Growth Model
This model tells us the yearly expected return based on growth of the earnings and shareholder yield.
The formula looks like the following:
Expected return = EPS growth + dividend yield +/- multiple expansion (contraction)Here are the assumptions I use:
EPS Growth = 30% per year over the next 10 years (my own estimate based on the latest yoy EPS growth)
Dividend Yield = / (there is no dividend)
Forward PE to increase from 76x (current) to 32x (median) over the next 10 years
Expected return = 30% + 0 + 0.1*((32-76)/76))= 24.21%So, this means that we should be happy with a return of 24.21% per year.
In case of a more conservative EPS growth: a 20% EPS growth, we get the following:
Expected return = 20% + 0 + 0.1*((32-76)/76))= 14.21%With an estimated 20% EPS growth, we should expect a 14.21% return per year.
Reverse DCF
A reverse DCF is very easy to execute.
When looking at this model, you only need to know 3 main things:
The current stock price of the company
The number of shares outstanding
The Free Cash Flow in Year 1
Next to the following three things, you also need the following:
Perpetuity Growth rate: growth rate after year 10
Use 3% ( this the average growth of the global economy)
Discount rate: The % used to discount future cash flows to today, accounting for risk and time
Discount rate = a proxy for our expected return
20% (the expected return, it’s important to notice that if you adjust this the impact will be huge on the model) (for a growth stock I expect at least a 20% return per year)
With a discount rate of 20%, you can expect a yearly return of 20% as an investor
Let’s use this model for Robinhood.
Robinhood
Let’s look into a Reverse DCF for Robinhood.
We need to know three things:
The current stock price of the company
The number of shares outstanding
The Free Cash Flow in Year 1
The current stock price as of the 5th of July is:
$94.40
The number of shares outstanding are:
883 million
The Free Cash Flow in Year 1
$1.270 million (expected FCF for 2025)
Two adjustments need to be made to Robinhood’s FCF:
Subtract Stock-Based Compensation (cost for shareholders)
Add Growth CAPEX
Stock-Based Compensation
Stock-based compensation is a cost for shareholders.
As a result, we subtract it from Robinhood’s FCF.
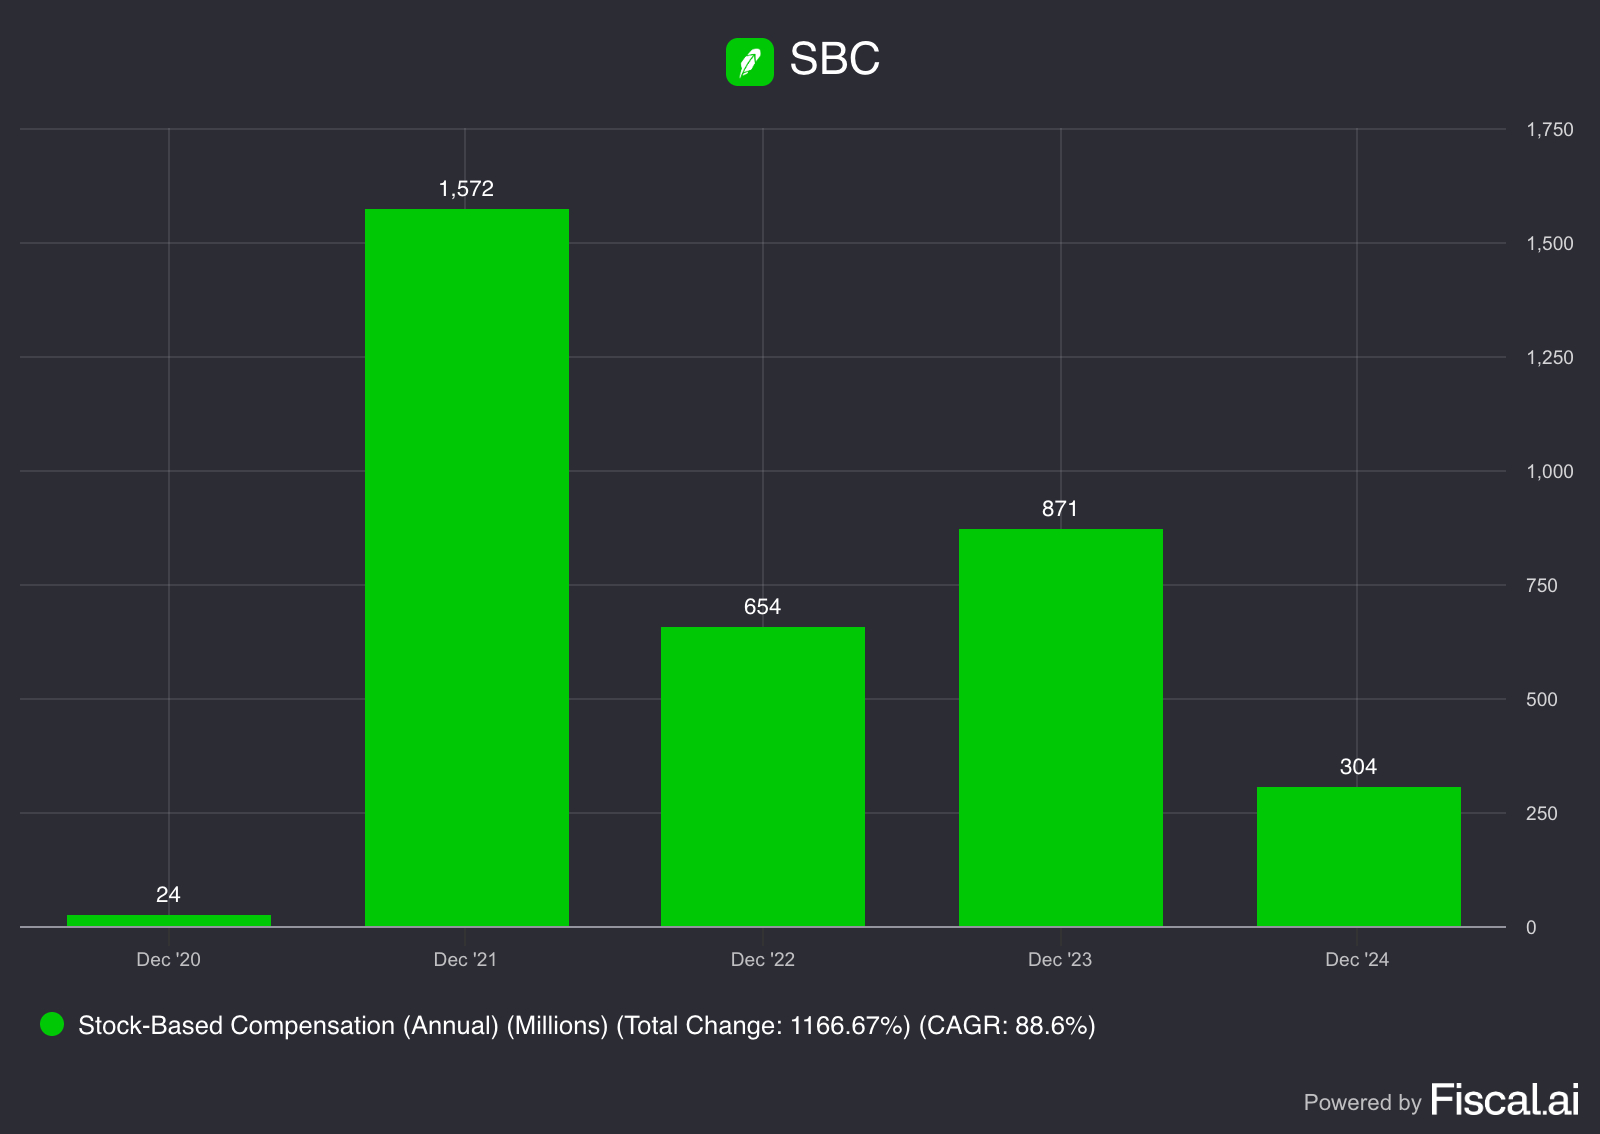
Robinhood’s Stock-Based Compensation = $304 million
Adding Growth Capex
A distinction can be made between Maintenance Capex and Growth Capex:
Maintenance Capex: Investments made in existing assets
Growth Capex: Investments made in new assets in order to grow
When a company invests a lot in future growth, its growth capex is very high but these investments should create a lot of value in the long term.
As a rule of thumb, we state that the company’s maintenance capex equals Depreciation & Amortiziation.
Capex = Maintenance Capex + Growth Capex
Maintenance Capex = Depreciation & Amortiziation
Growth Capex = Total Capex - Depreciation & Amortiziation
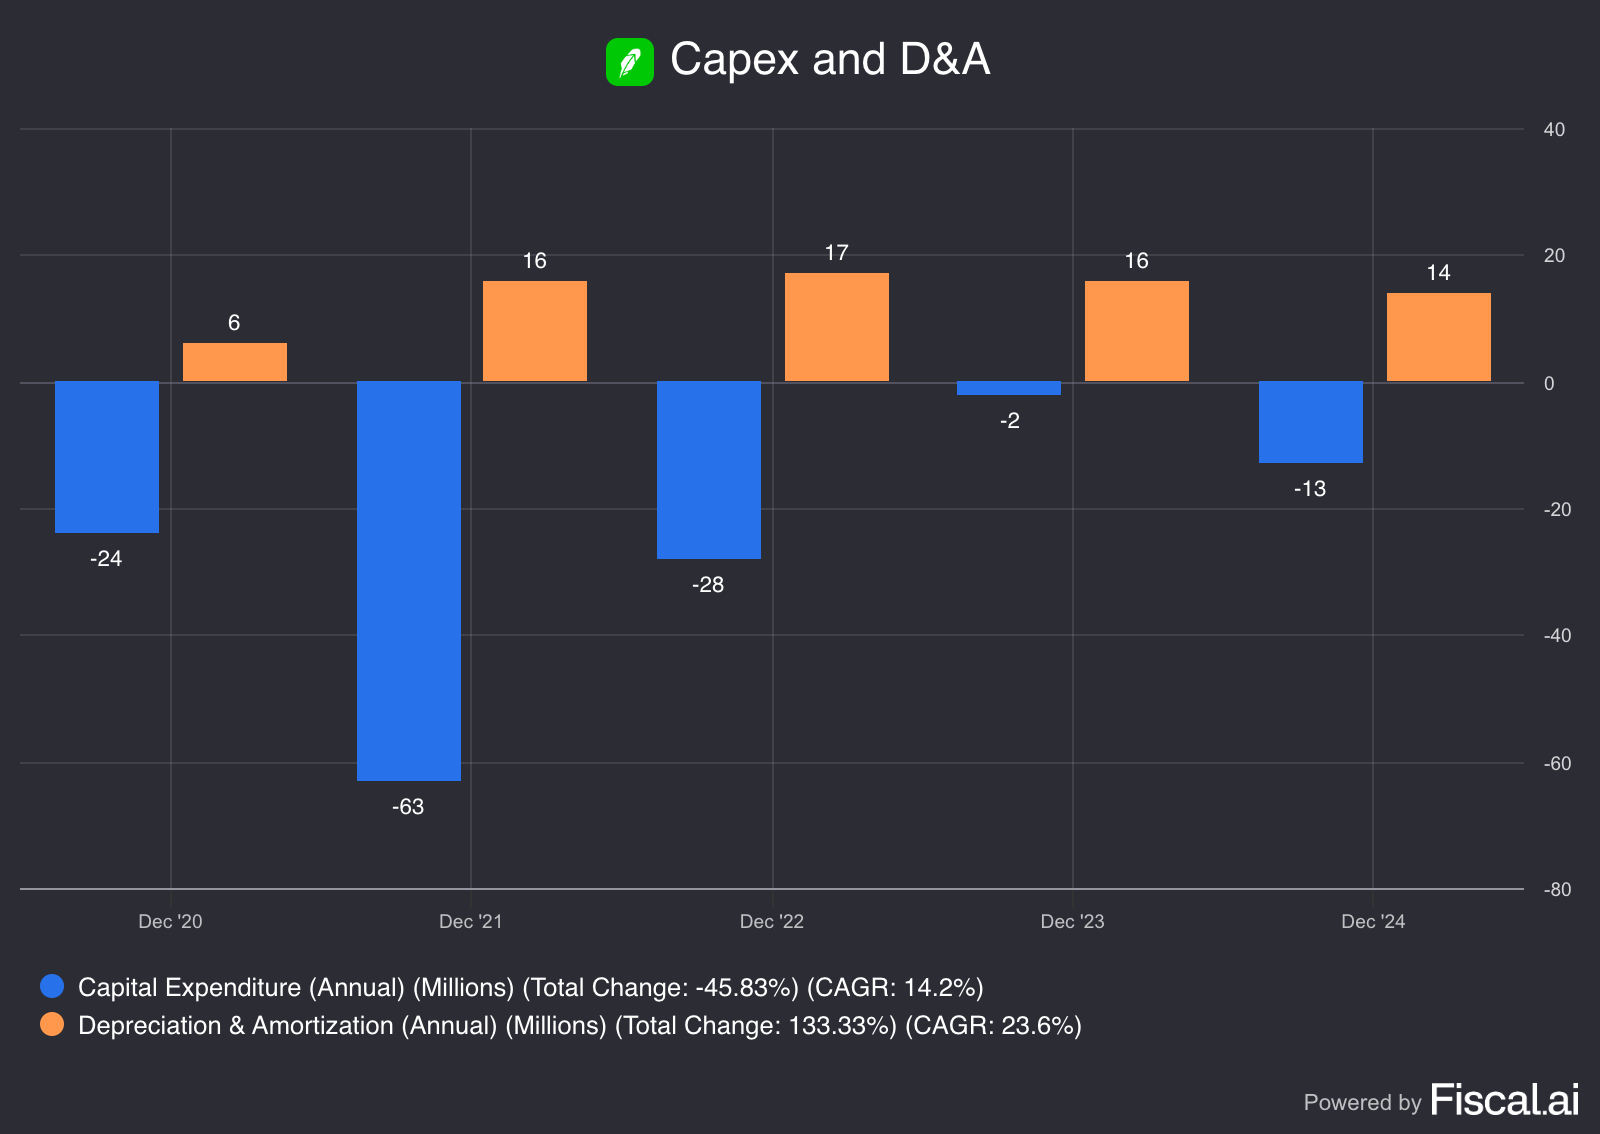
Capex = $13 million
Depreciation & Amortization = $14 million
Now that we have the following numbers, we can calculate the Growth Capex:
Growth Capex = Total Capex - Depreciation & Amortization
Growth Capex = $13 million - $14 million
Growth Capex = -$1 million
As we know the Free Cash Flow, Stock-Based Compensation and Growth CAPEX, we can now calculate the adjusted Free Cash Flow we use in our model:
Adjusted FCF = FCF - SBC + Growth Capex
Adjusted FCF = $1.270 million - $304 million - $1 million
Adjusted FCF = $965 million
Excel Spreadsheet
Now we go to our Excel spreadsheet and fill in all the information.
Our input looks as follows:

The only thing we still need to do is click the ‘Calculate Growth Rate’ button.
After you click it, you get the following:

But, what does this mean?
Look at the growth rate (year 1-10).
This number shows you how much Robinhood’s FCF should grow in the next 10 years to generate a return of 20% per year for you as a shareholder.
Robinhood needs to grow its FCF by 55,43% per year to generate an annualised return of 20%.
Is this realistic?
Let’s look at two things:
The historical FCF Growth of Robinhood
Analysts’ expectations
Historical FCF Growth
The evolution of Robinhood’s FCF looks as follows:
As you can see in the chart above, Robinhood has quite a fluctuating Free Cash Flow growth. Therefore, I will not be using this stat to compare with the reverse DCF model. And I will just look at the numbers that analysts are referring to.
Analysts’ expectations
Now, we are going to look into what analysts expect from Robinhood in the years ahead.
EPS isn’t the same as FCF, but we use it as a proxy because FCF estimates aren’t available.
As you can see below, analysts expect Robinhood to only grow its FCF (/EPS) by 11% per year.

Is Robinhood overvalued or undervalued?
Now, let’s determine whether Robinhood is overvalued or undervalued.
Expectations implied in the current stock price (Reverse DCF): 55,43%
→ Robinhood should grow its FCF by 55,43% per year to generate a return of 20% per year for you as an investor.
Is this realistic?
→ Analysts expect Robinhood to only grow its FCF by 11% per year in the years ahead.
The numbers suggest that Robinhood is massively overvalued at its current price. Considering the full picture, I would rate Robinhood as a Hold/Sell for the simple fact that the reverse DCF model shows that it’s overvalued and the fact that the stock has been running to unknowingly high levels. The risk/reward on Robinhood doesn’t look appealing at all.
2. Technical Analysis
In this second section, I’ll cover a short Technical Analysis on Robinhood.

As shown in the chart, Robinhood’s price is currently trading at all time highs around $94,40. I’ve identified a potential BUY zone between $35,50 and $29.
Based on the current price action, Robinhood appears to be in a price-discovery territory meaning that right now stepping into this stock would be the most foolish thing to do. You would at least want the price to go back to 65 dollars to even consider opening up a starter position. So, right now I would stay away from this stock cause the potential downside is way higher than the potential upside.
(So, right now this doesn’t look appealing to Buy. I would prefer to buy them back at previous levels or buy at current levels when we see them testing these levels again.)
If you enjoyed reading this breakdown article, you might enjoy these other breakdowns to:


Thank you for reading this article! If you enjoyed reading it, make sure to SUBSCRIBE so you don’t miss out any posts! And share, leave a comment!
Disclaimer: Here