
Fundamentals meet Technicals: TSMC (Taiwan Semiconductor)
A Fundamental and Technical Analysis.


So, today we’ll discuss whether TSMC seems like a stock to keep an eye on or not.
Overview
Today, I’ll cover the following of TSMC:
Fundamental Analysis
Technical Analysis
This is also the framework that I’ll be using when doing a Deep Dive into any company that might be ready to BUY.
If you’re interested in seeing more of these Deep Dives where I discuss a companies Fundamentals and Technicals, make sure to SUBSCRIBE so you don’t miss any insights!
As a thank you for reading this article, I’m giving you a discount so you can get full access to my Gold Community!
1. Fundamental Analysis
In the next section, I’ll discuss the following things:
General Overview (Total Revenues, Net Income, EBIT, Free Cash Flow)
Skin in the game
Gross Profit and Net Income Margin
ROIC
Goodwill
Capex (Maintenance/Growth)
Stock-Based Compensation
Buybacks
Forward P/E
Forward P/FCF
Earnings Growth Model
Reverse DCF
General Overview
In this first part, I’ll discuss the overall fundamentals of the business: Total Revenues, Net Income, EBIT, Free Cash Flow.
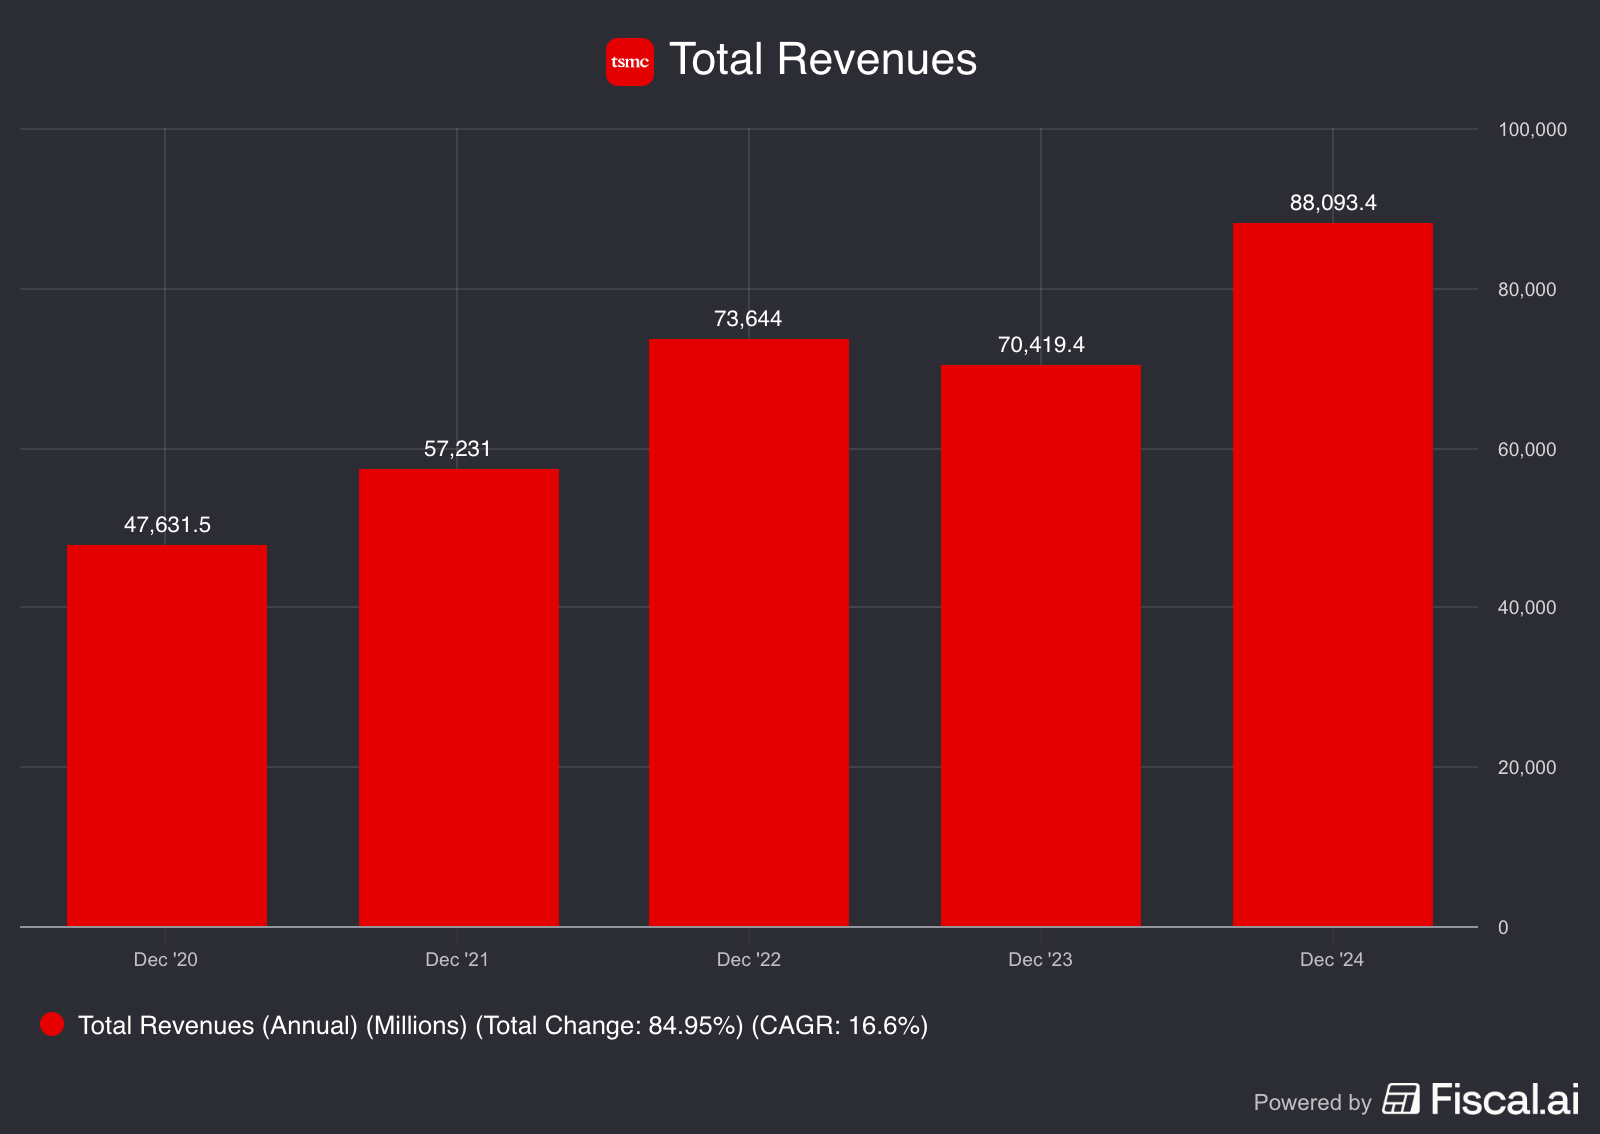
Total Revenues
Total revenue performance from 2020 to 2024 demonstrates stable growth with a 17% CAGR. That’s a more than solid top line growth, if you ask me.
Any shareholder should be happy with this.
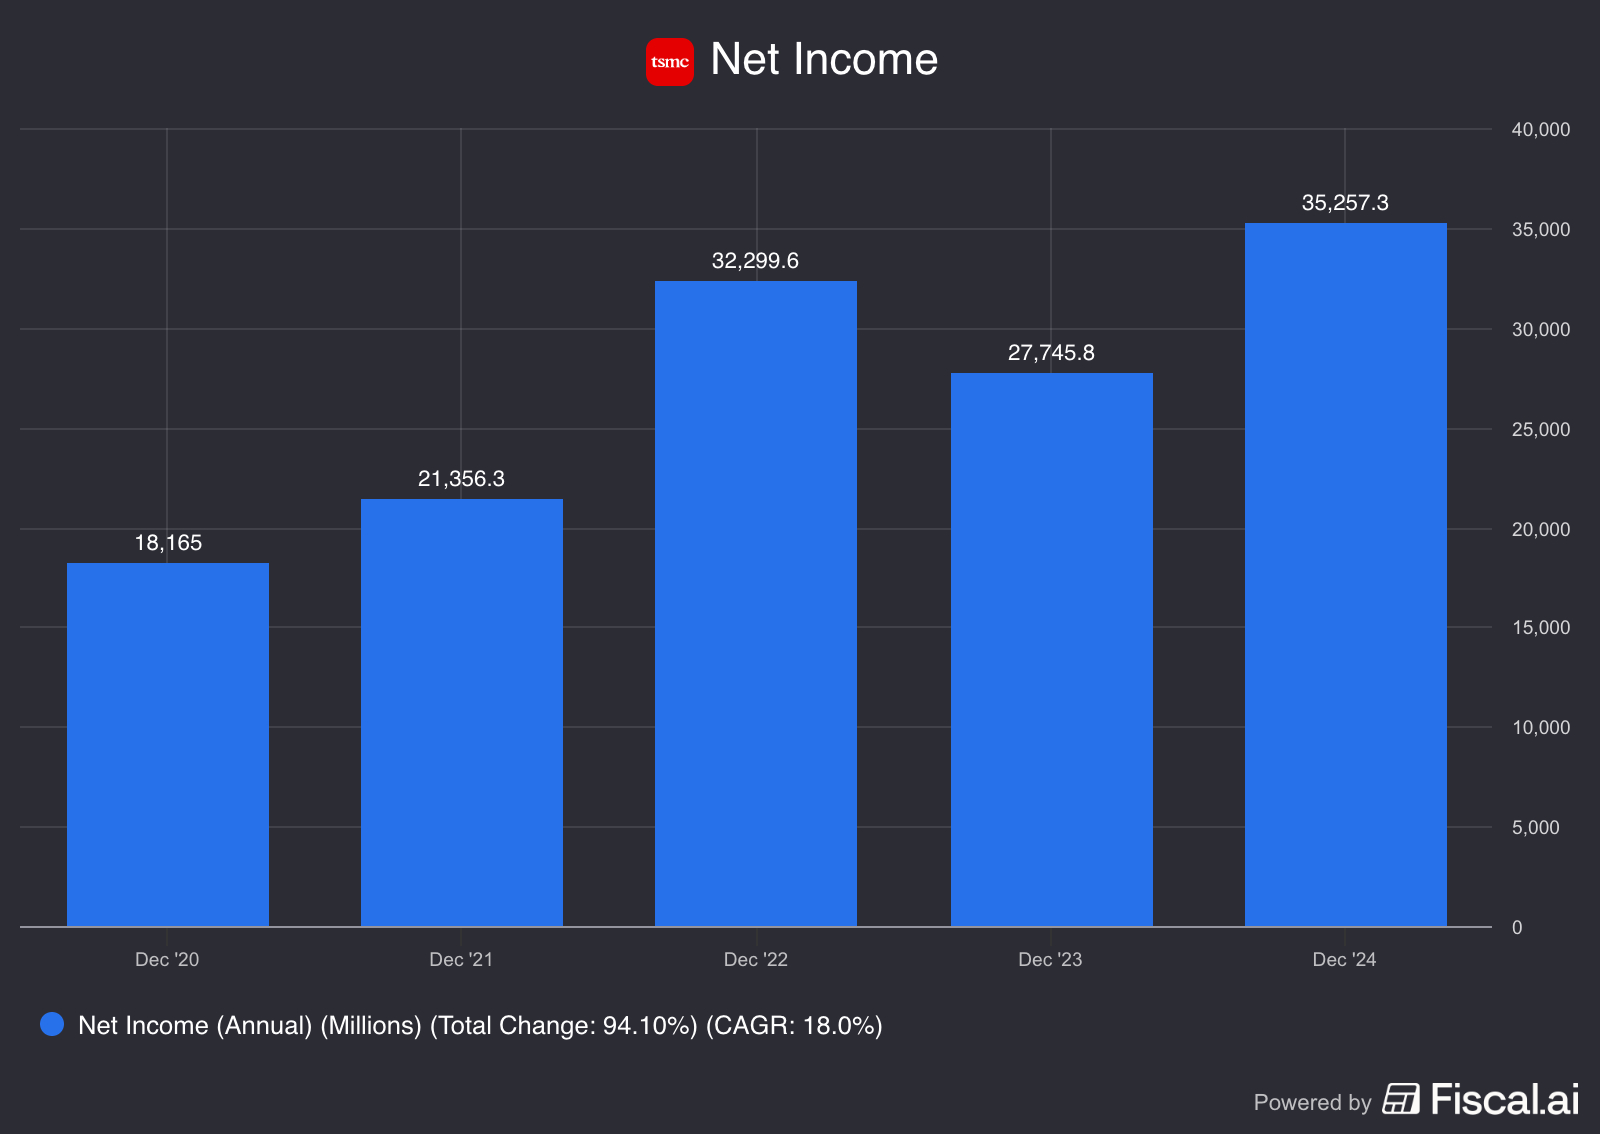
Net Income
TSMC’s net income trajectory shows a strong and stable growth path. From $18,165M in 2020, to over $35,257 million. Management seems to know how they can keep increasing their bottom line.
And the biggest shift in net income happened in 2022.
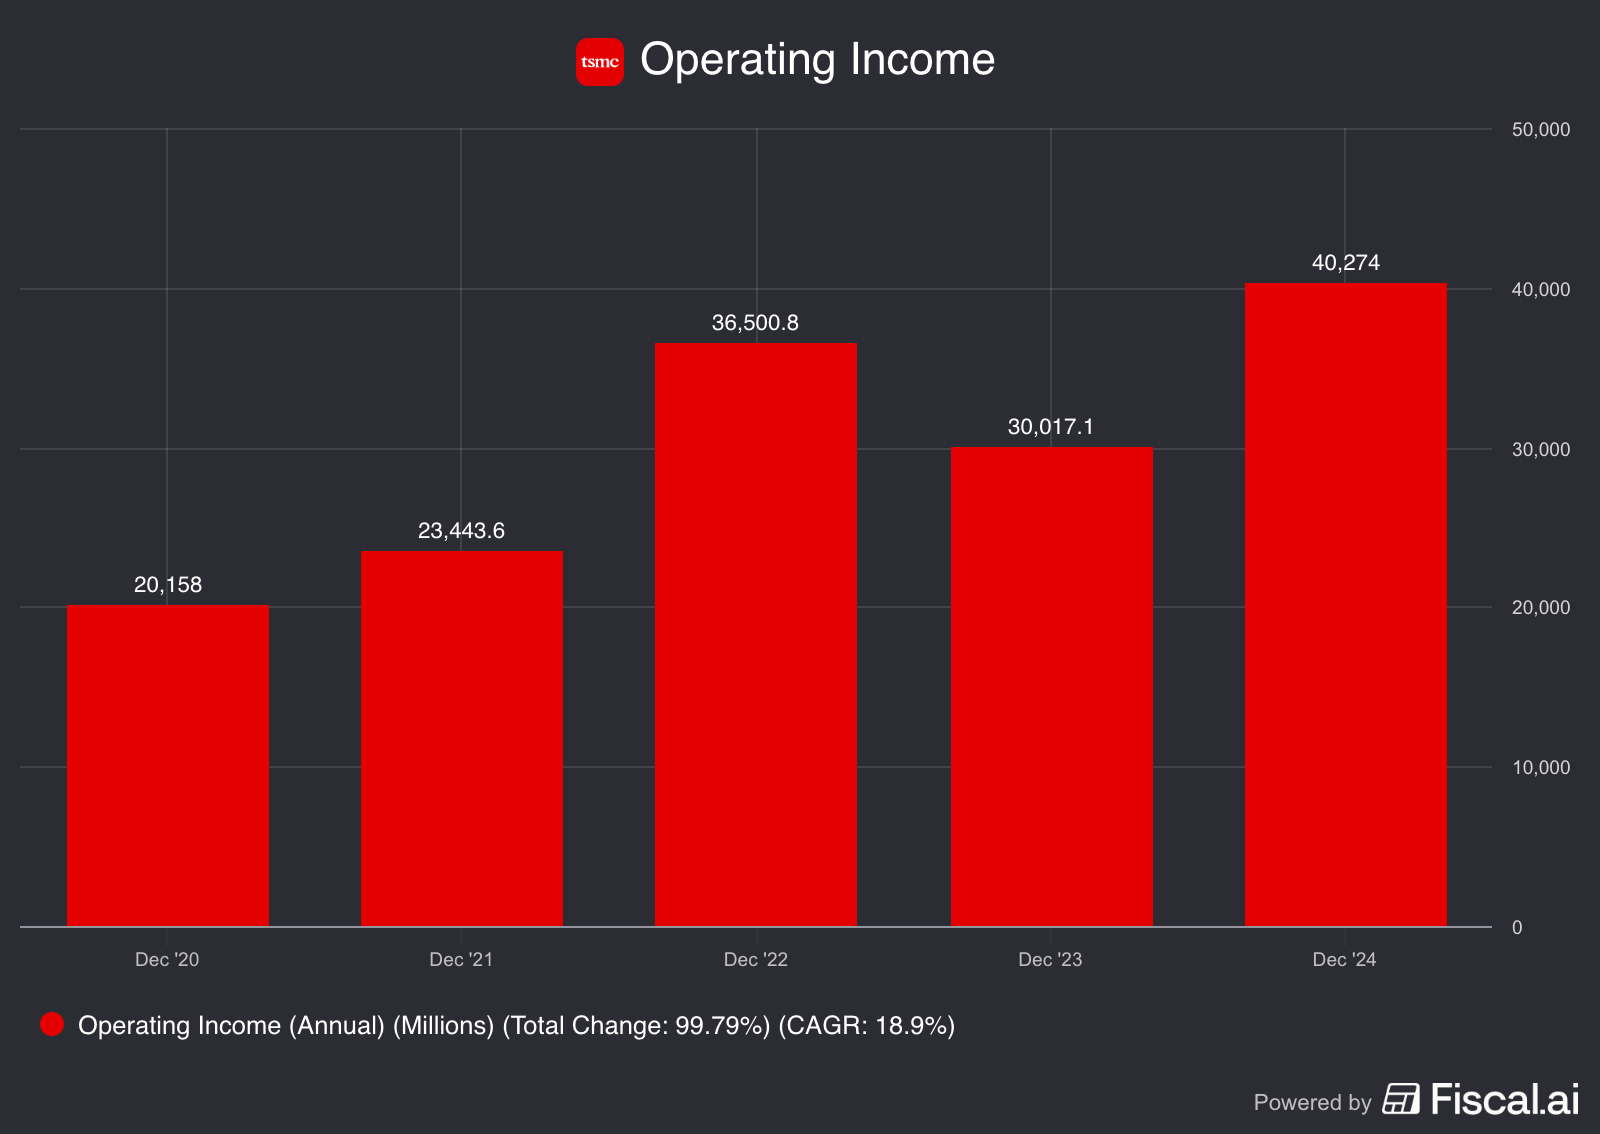
EBIT/Operating Income
The operating income shows stable growth.
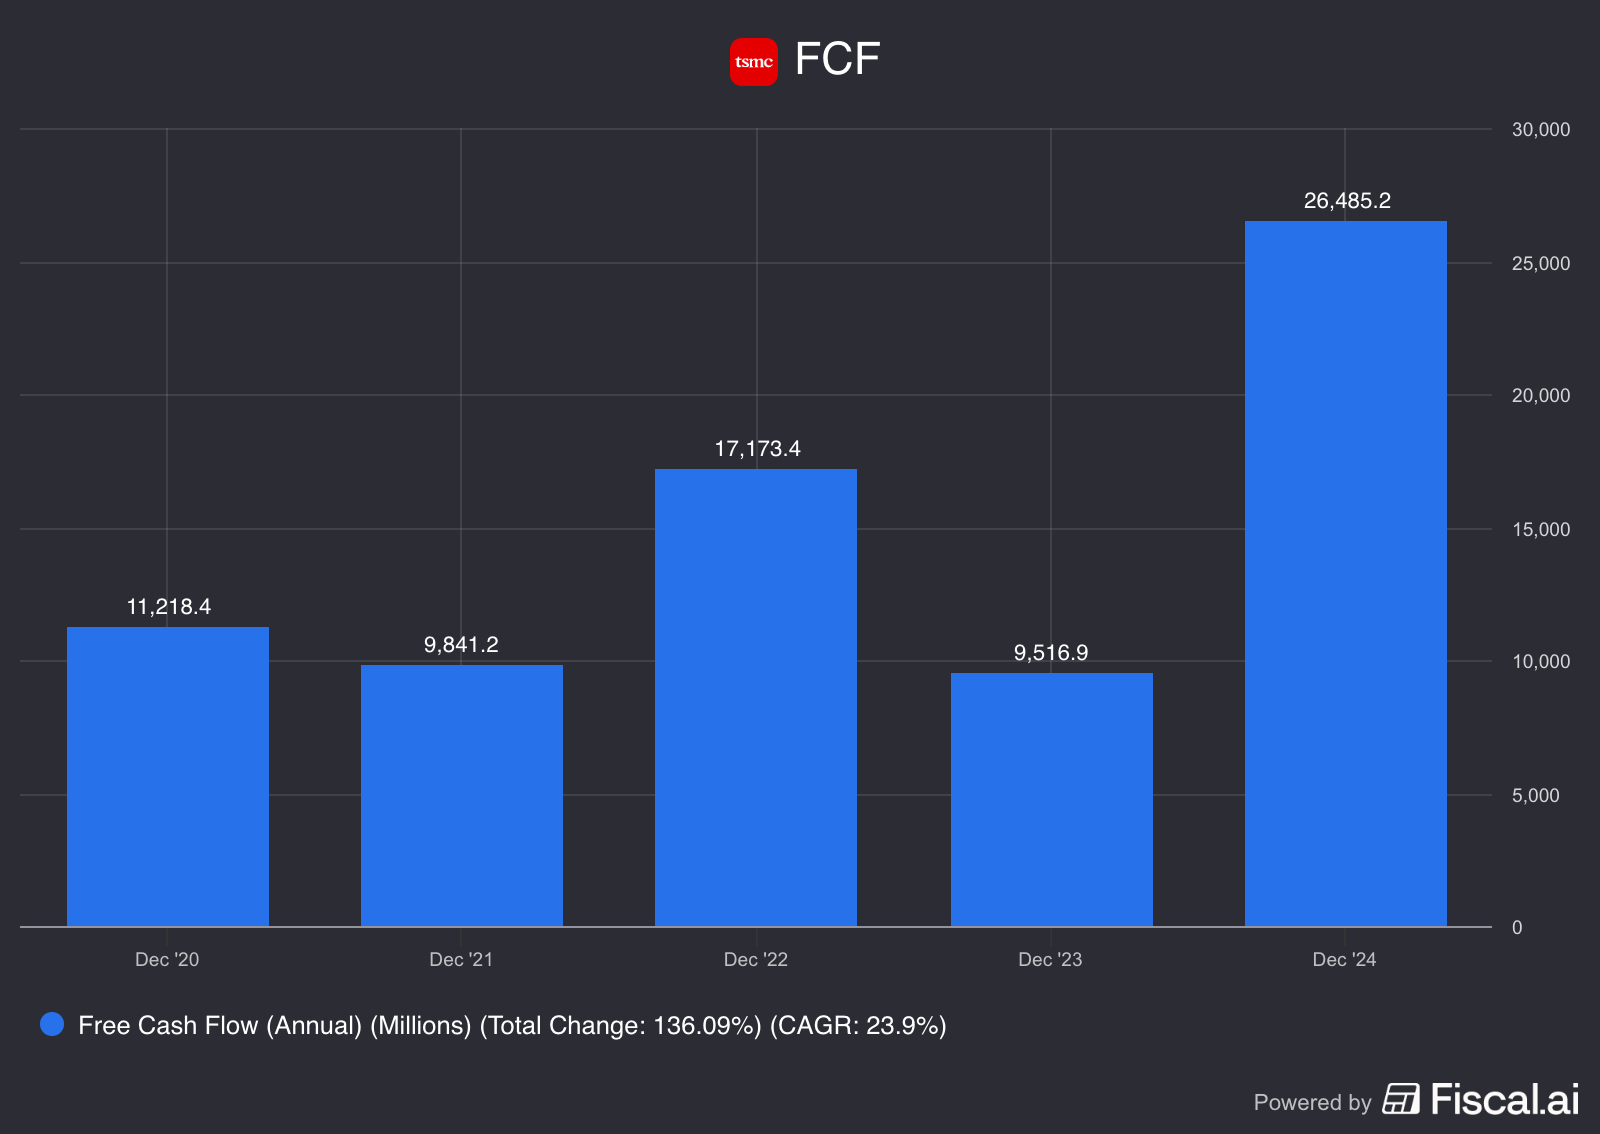
Free Cash Flow
Free Cash Flow(FCF) shows solid growth. Last year, they got their biggest increase in FCF ever, a stunning $26,495M.
Just be looking at the four metrics above (Revenue, Net Income, Operating Income, FCF) and seeing how solid they are and how strong they are growing, gives us a great indication of what’s to come for this business.
Skin in the game
"Skin in the game" matters for investors evaluating management commitment.
Taiwan Semiconductor (TSM) has insider ownership of just around 0.39%, we would like to see an insider ownership above (or around) 10% (=benchmark). Because that typically aligns management incentives with shareholder values.
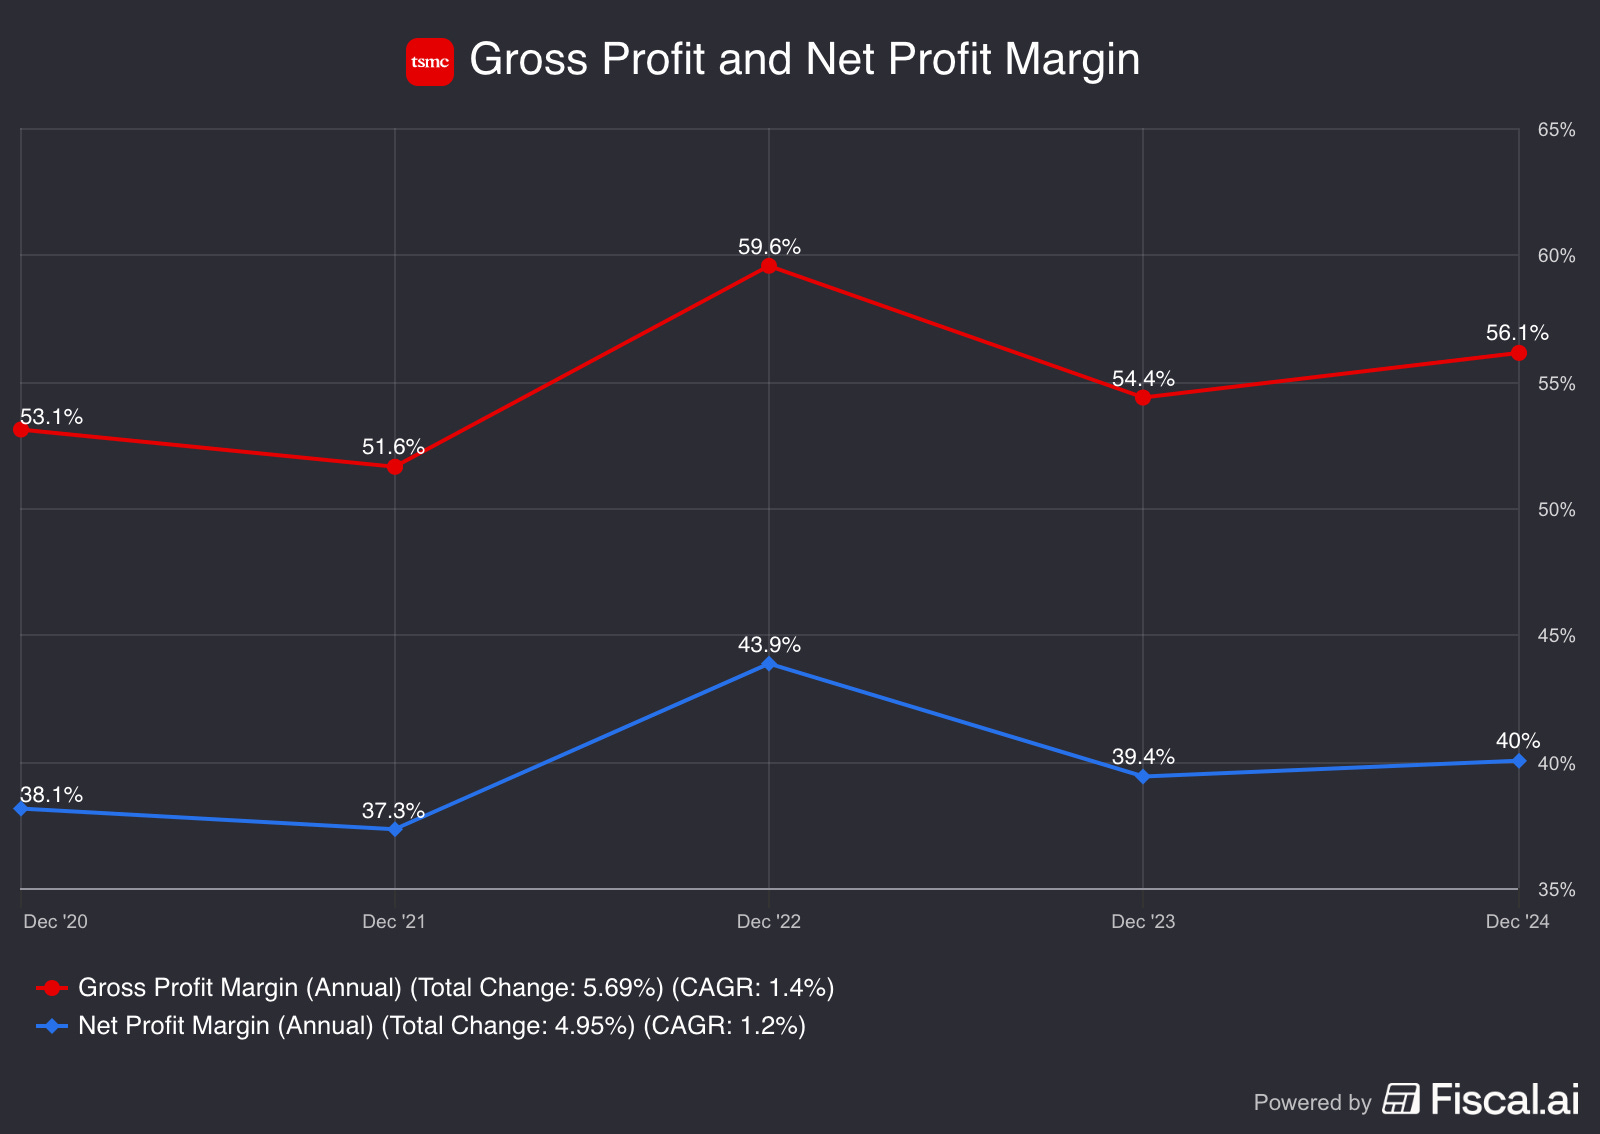
Gross Profit and Net Income Margin
The margin profile shows steady operating profit margins, and net profit margins. These are the type of margins you love to see as an investor.
All positive signs.
If you need more information on TSMC’s Business Model, and specifically in depth information on where most of their revenue is coming from, go and check out this article:

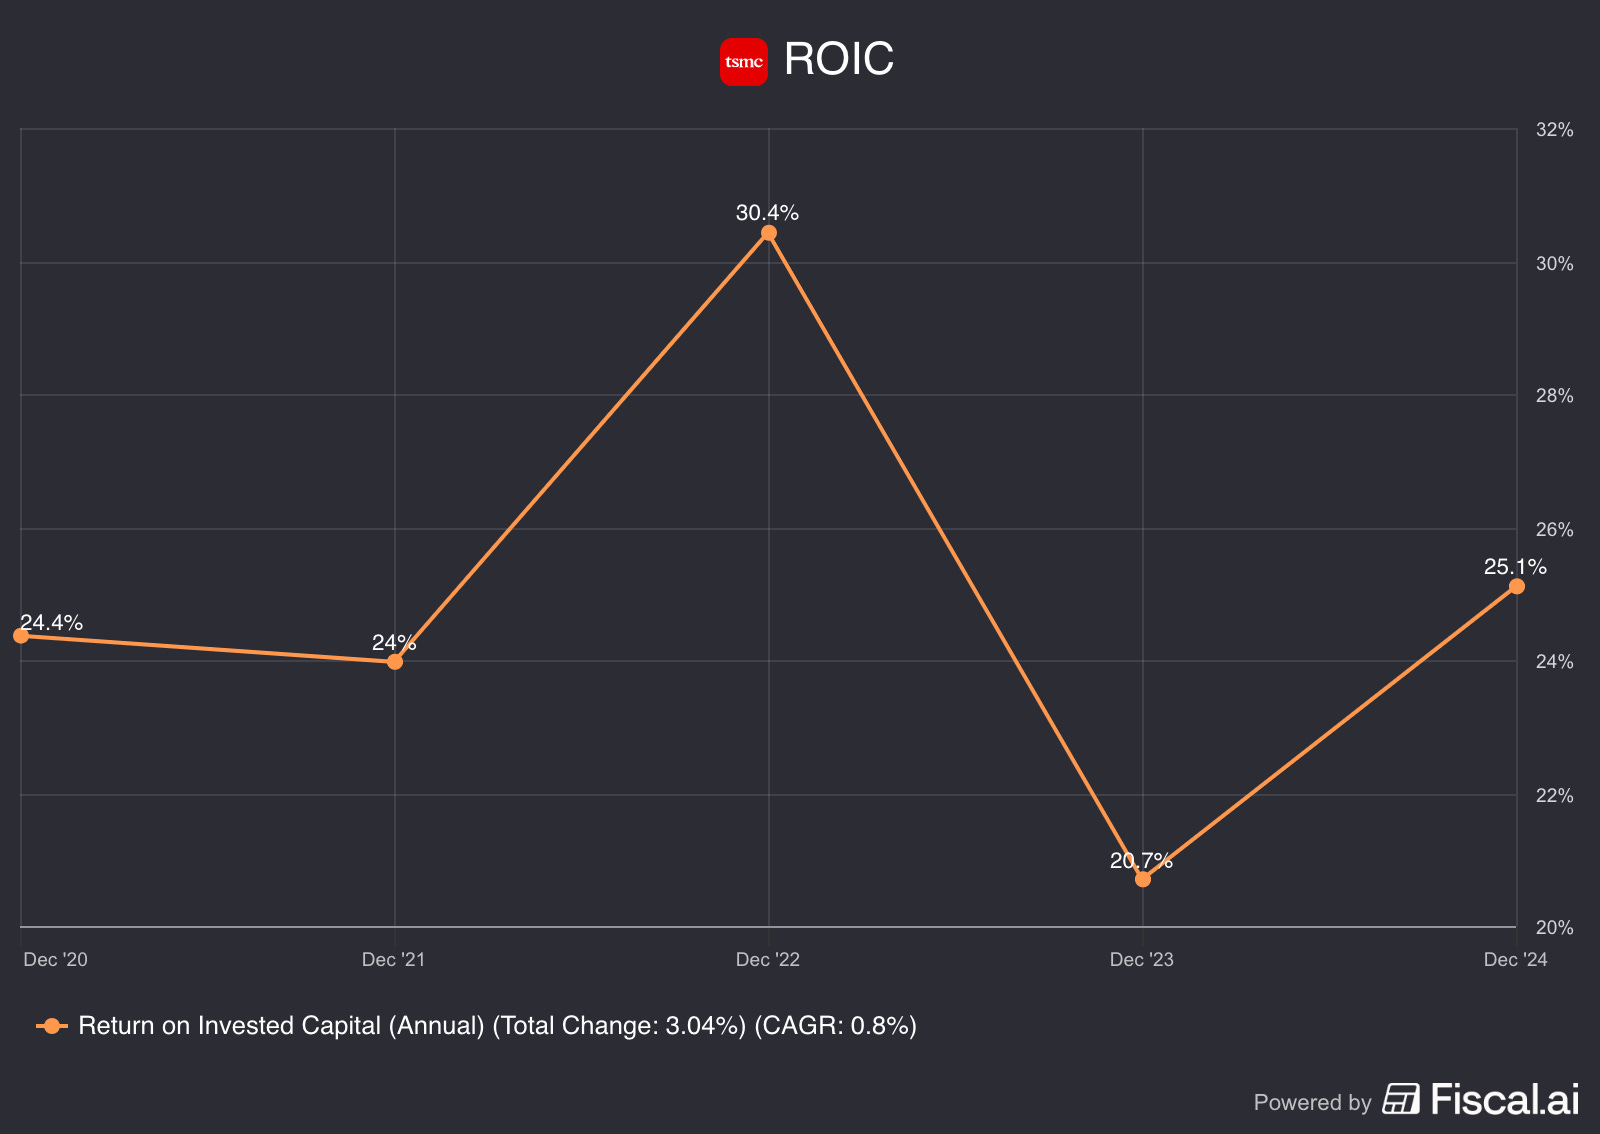
Return on Invested Capital (ROIC)
Over the past few years, TSMC’s return on invested capital (ROIC) has increased a lot. This indicates that the company is making good investment decisions.
A 25% ROIC is really solid. This means that management knows how to allocate capital and let it grow over time.
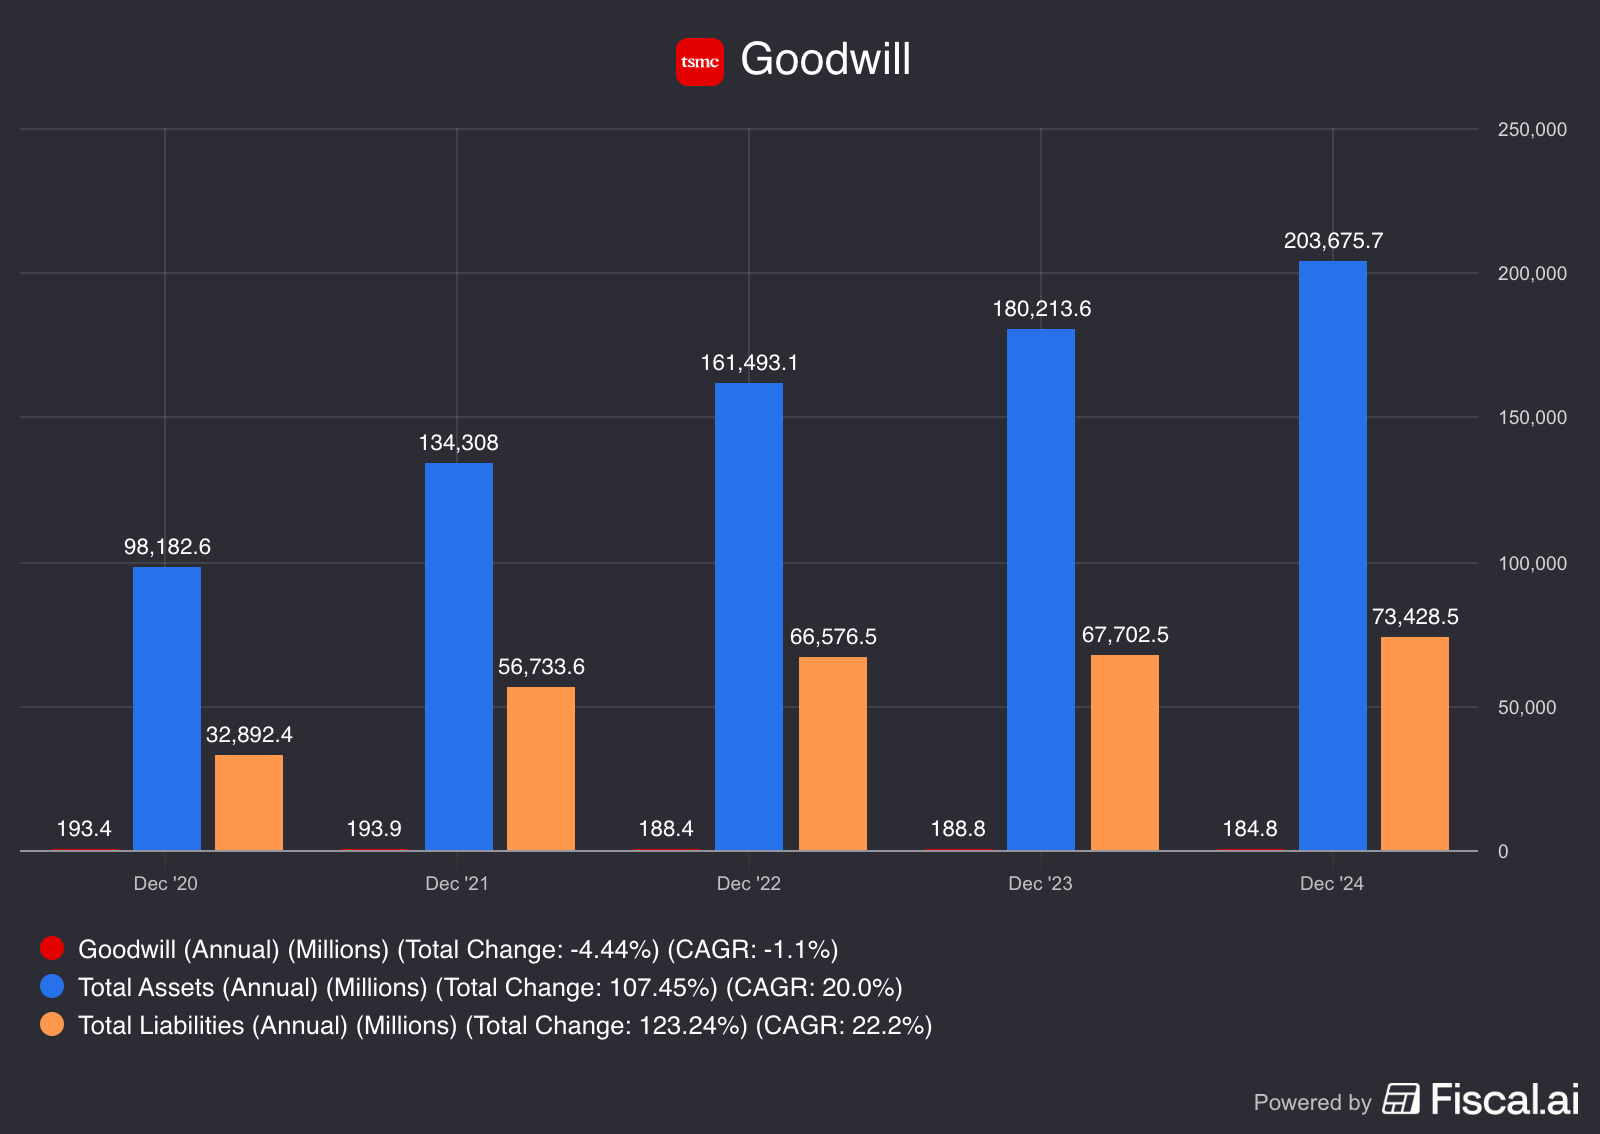
Goodwill
TSMC’s goodwill has been close to non existing for over five years, meaning that there is no impact from M&A’s on the balance sheet.
This a really positive sign. It’s says a lot about the true organic strength of the business.
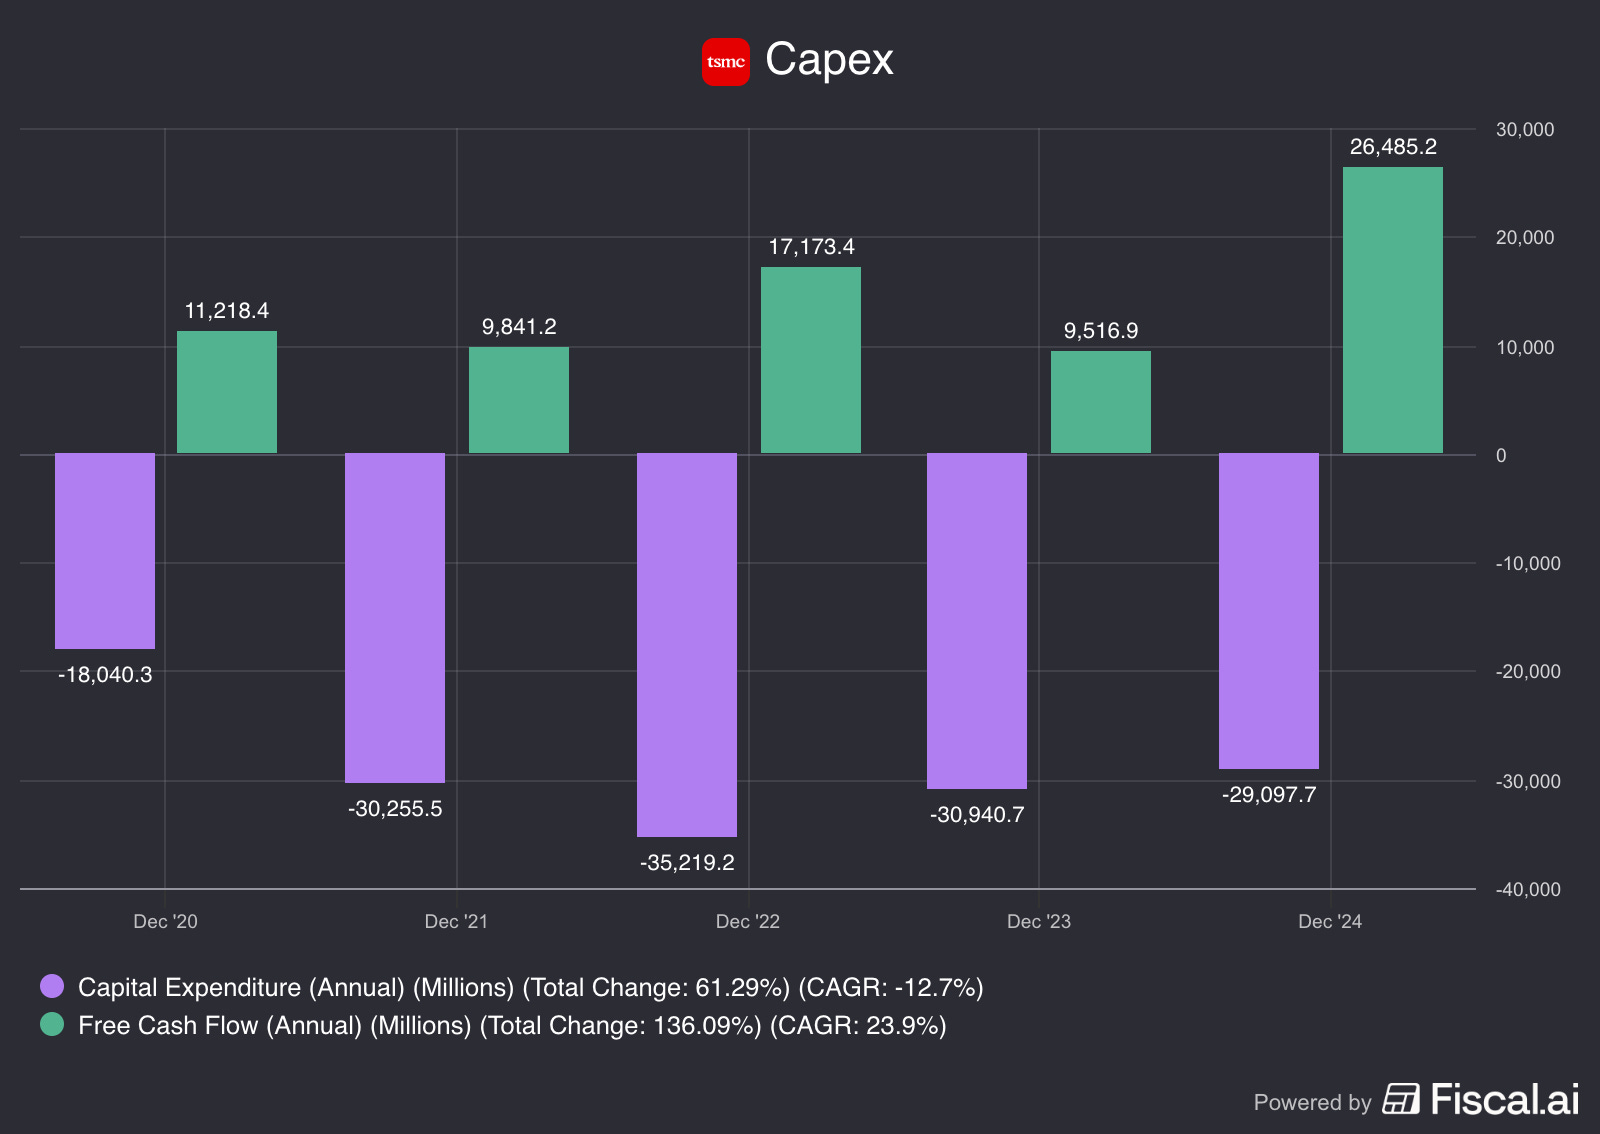
Capex (Maintenance/Growth)
As you can see capex is declining.
This is a positive sign because it means that the impact on their FCF is declining.
If you like what you are reading, here is a gift!
Stock Based Compensation
Stock-Based Compensation (SBC) is a non-cash expense which means that it affects financial statements but does not directly impact Free Cash Flow (FCF).
However, it does have indirect effects on a company’s financial health and valuation.
How SBC Affects Free Cash Flow
SBC is Added Back to Operating Cash Flow (OCF):
Since SBC is a non-cash expense, it is deducted from net income on the Income Statement but added back when calculating Operating Cash Flow under the indirect method of cash flow reporting.
This can make FCF appear higher, even though it does not actually generate cash.
Potential Dilution Impact:
While SBC increases FCF in the short term (since it's a non-cash expense), it leads to more outstanding shares over time, which can dilute earnings per share (EPS) and affect stock value.
Investors should be cautious when high SBC artificially boosts FCF while increasing share dilution.
Adjusted Free Cash Flow (Adj. FCF)
To account for SBC’s impact, some investors use an adjusted FCF metric:
Adjusted FCF = FCF − SBC
This adjustment gives a more conservative view of true cash generation by treating SBC as an actual cost to shareholders.
Let’s now take a look at TSMC’s Stock-Based Compensation:
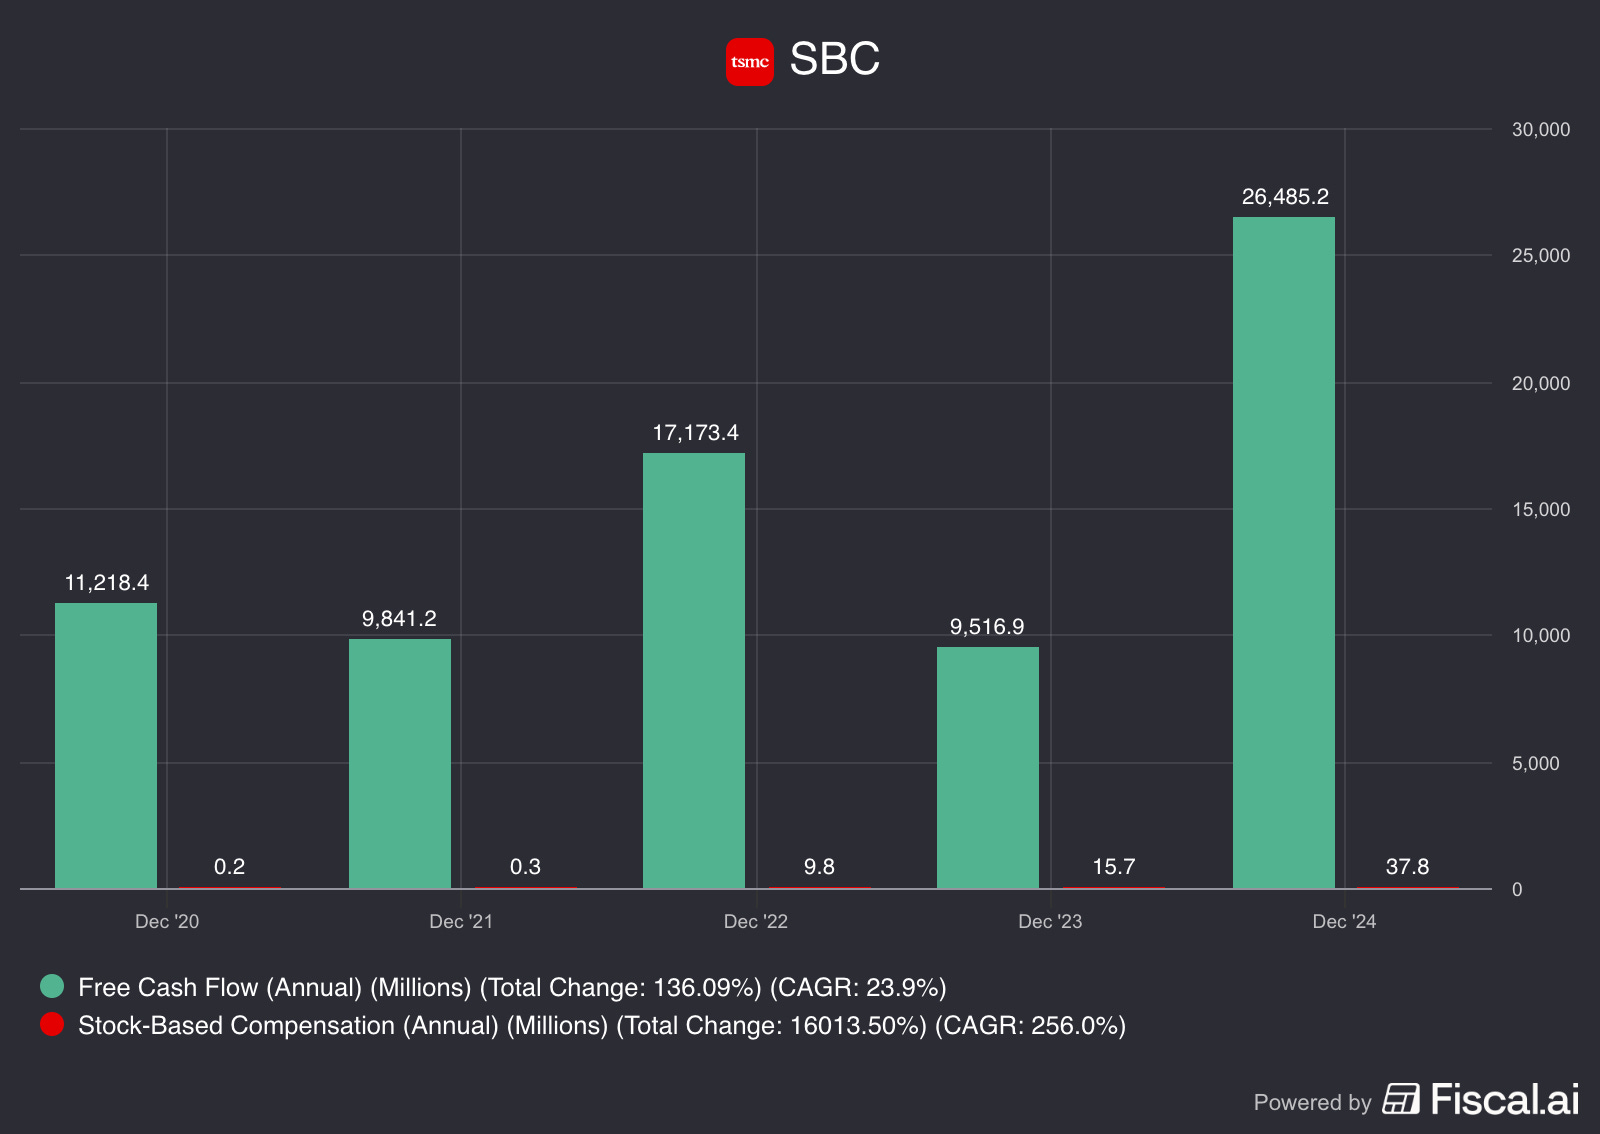
TSMC has been issuing Stock-Based Compensation (SBC), which impacts its reported free cash flow in a negative way and basically making free cash flow worthless. But, because there FCF is so huge in comparison, SBC doesn’t have an impact on their FCF.
Buybacks
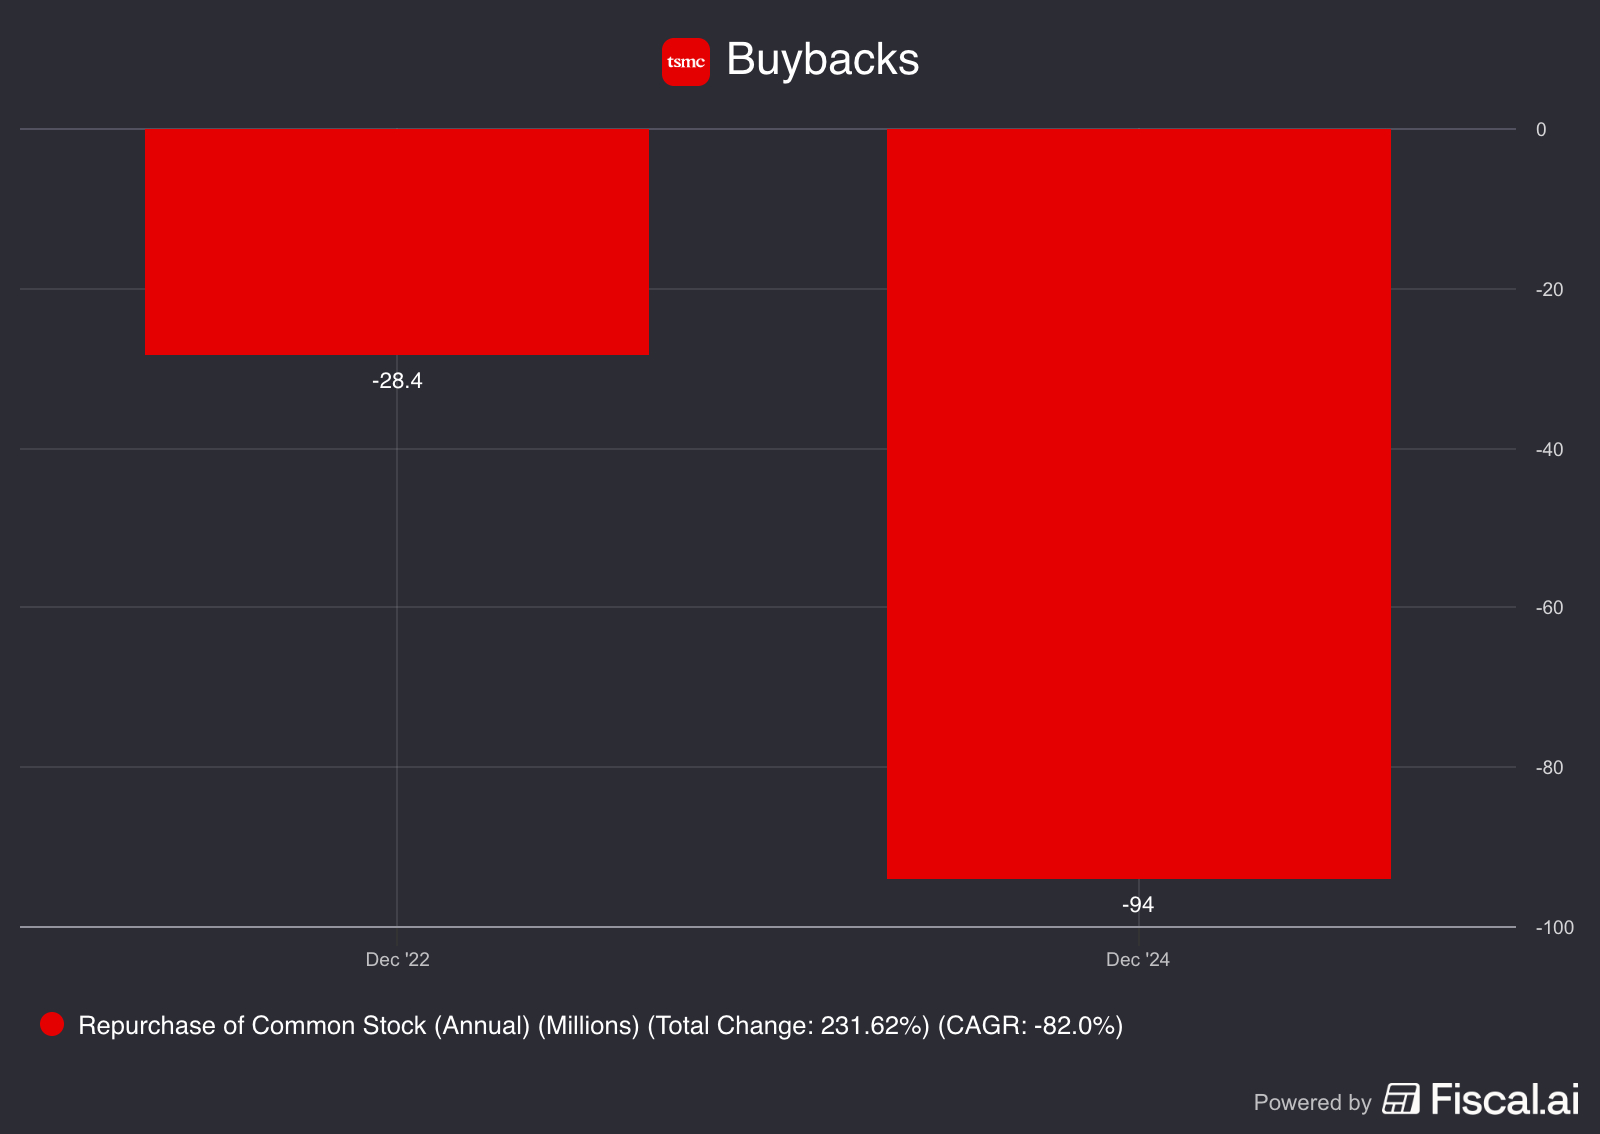
It appears that TSMC has bought back shares ever since 2022. Last year, they bought back around $94M.
As an investor, share buybacks are generally seen as a positive sign because they can increase the value of the shares you own. They often indicate management’s confidence in the company’s future and can help drive long term shareholder value.
If I’m being honest, I’m not the biggest fan of buybacks. I believe companies could put that money to better use by investing in initiatives that genuinely strengthen the business. Rather than spending cash on buybacks, they could focus on areas that drive long term growth and create real value. But hey, I’m just a simple investor, what do I know?
Forward P/E
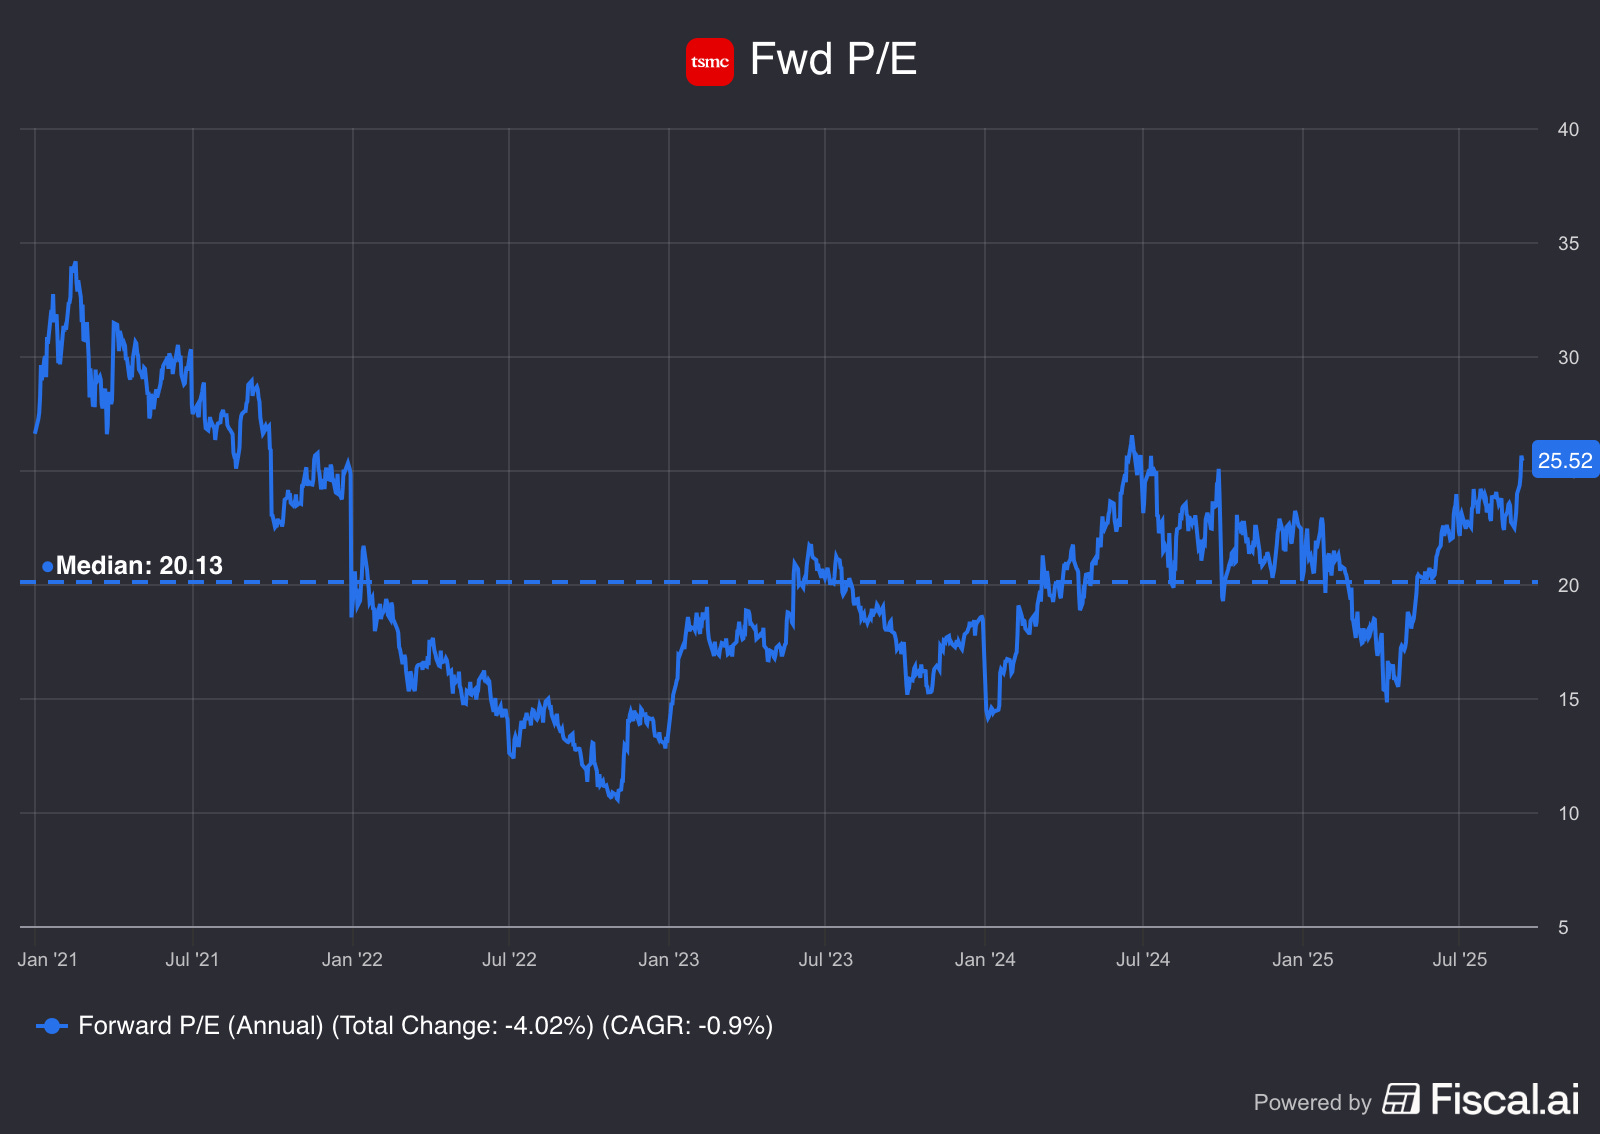
When I look at the Forward P/E, I always compare it to the stock’s historical median to get a sense of whether it’s undervalued or overvalued. But it’s also key to remember that this ratio is based on earnings, so if earnings are going down, the multiple can be pretty misleading. A low P/E might look attractive, but it doesn’t mean much if the business is struggling underneath.
TSMC’s forward P/E is trading well above its historical median, suggesting the stock may currently be overvalued based on this metric.
Forward P/FCF
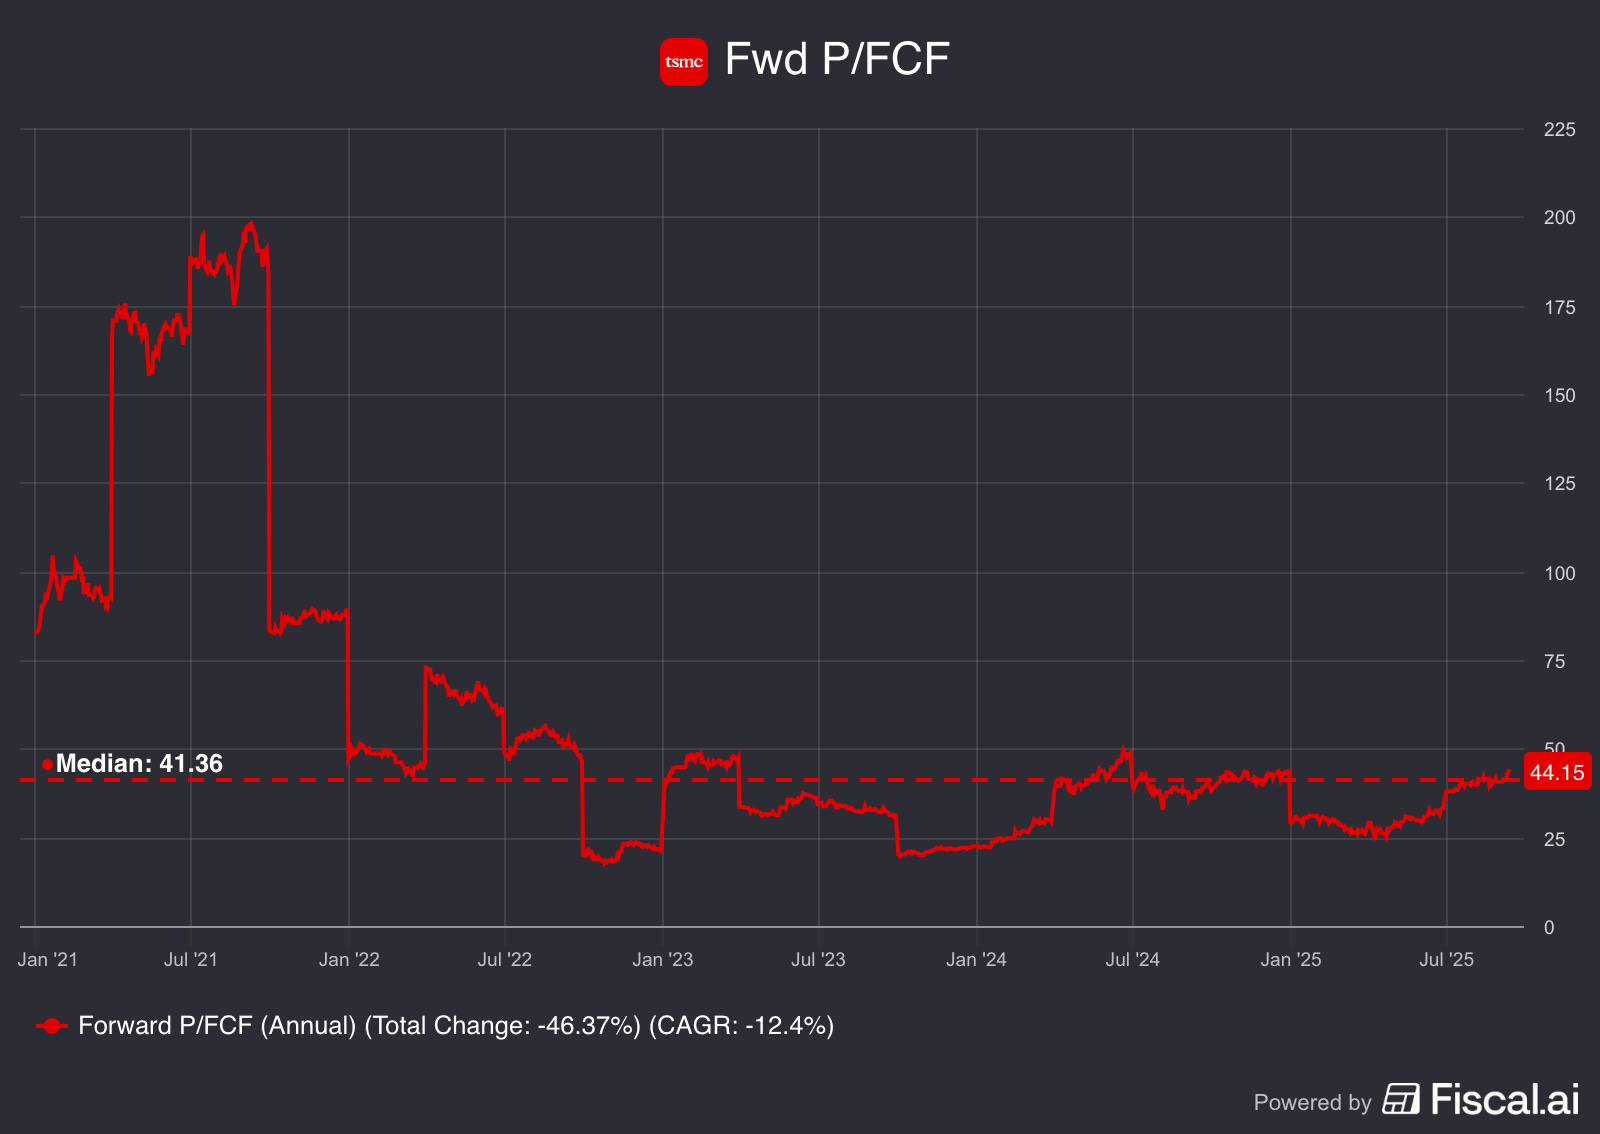
When I look at the Forward P/FCF, I always compare it to the stock’s historical median to get a sense of whether it’s undervalued or overvalued. But it’s also key to remember that this ratio is based on free cash flows, so if free cash flows are going down, the multiple can be pretty misleading. A low P/FCF might look attractive, but it doesn’t mean much if the business is struggling underneath.
TSMC’s forward P/FCF is trading above its historical median, suggesting the stock may currently be overvalued based on this metric.
As a thank you for reading this article, I’m giving you an even BIGGER DISCOUNT so you can get full access to my Gold Community! (only for a limited time available)